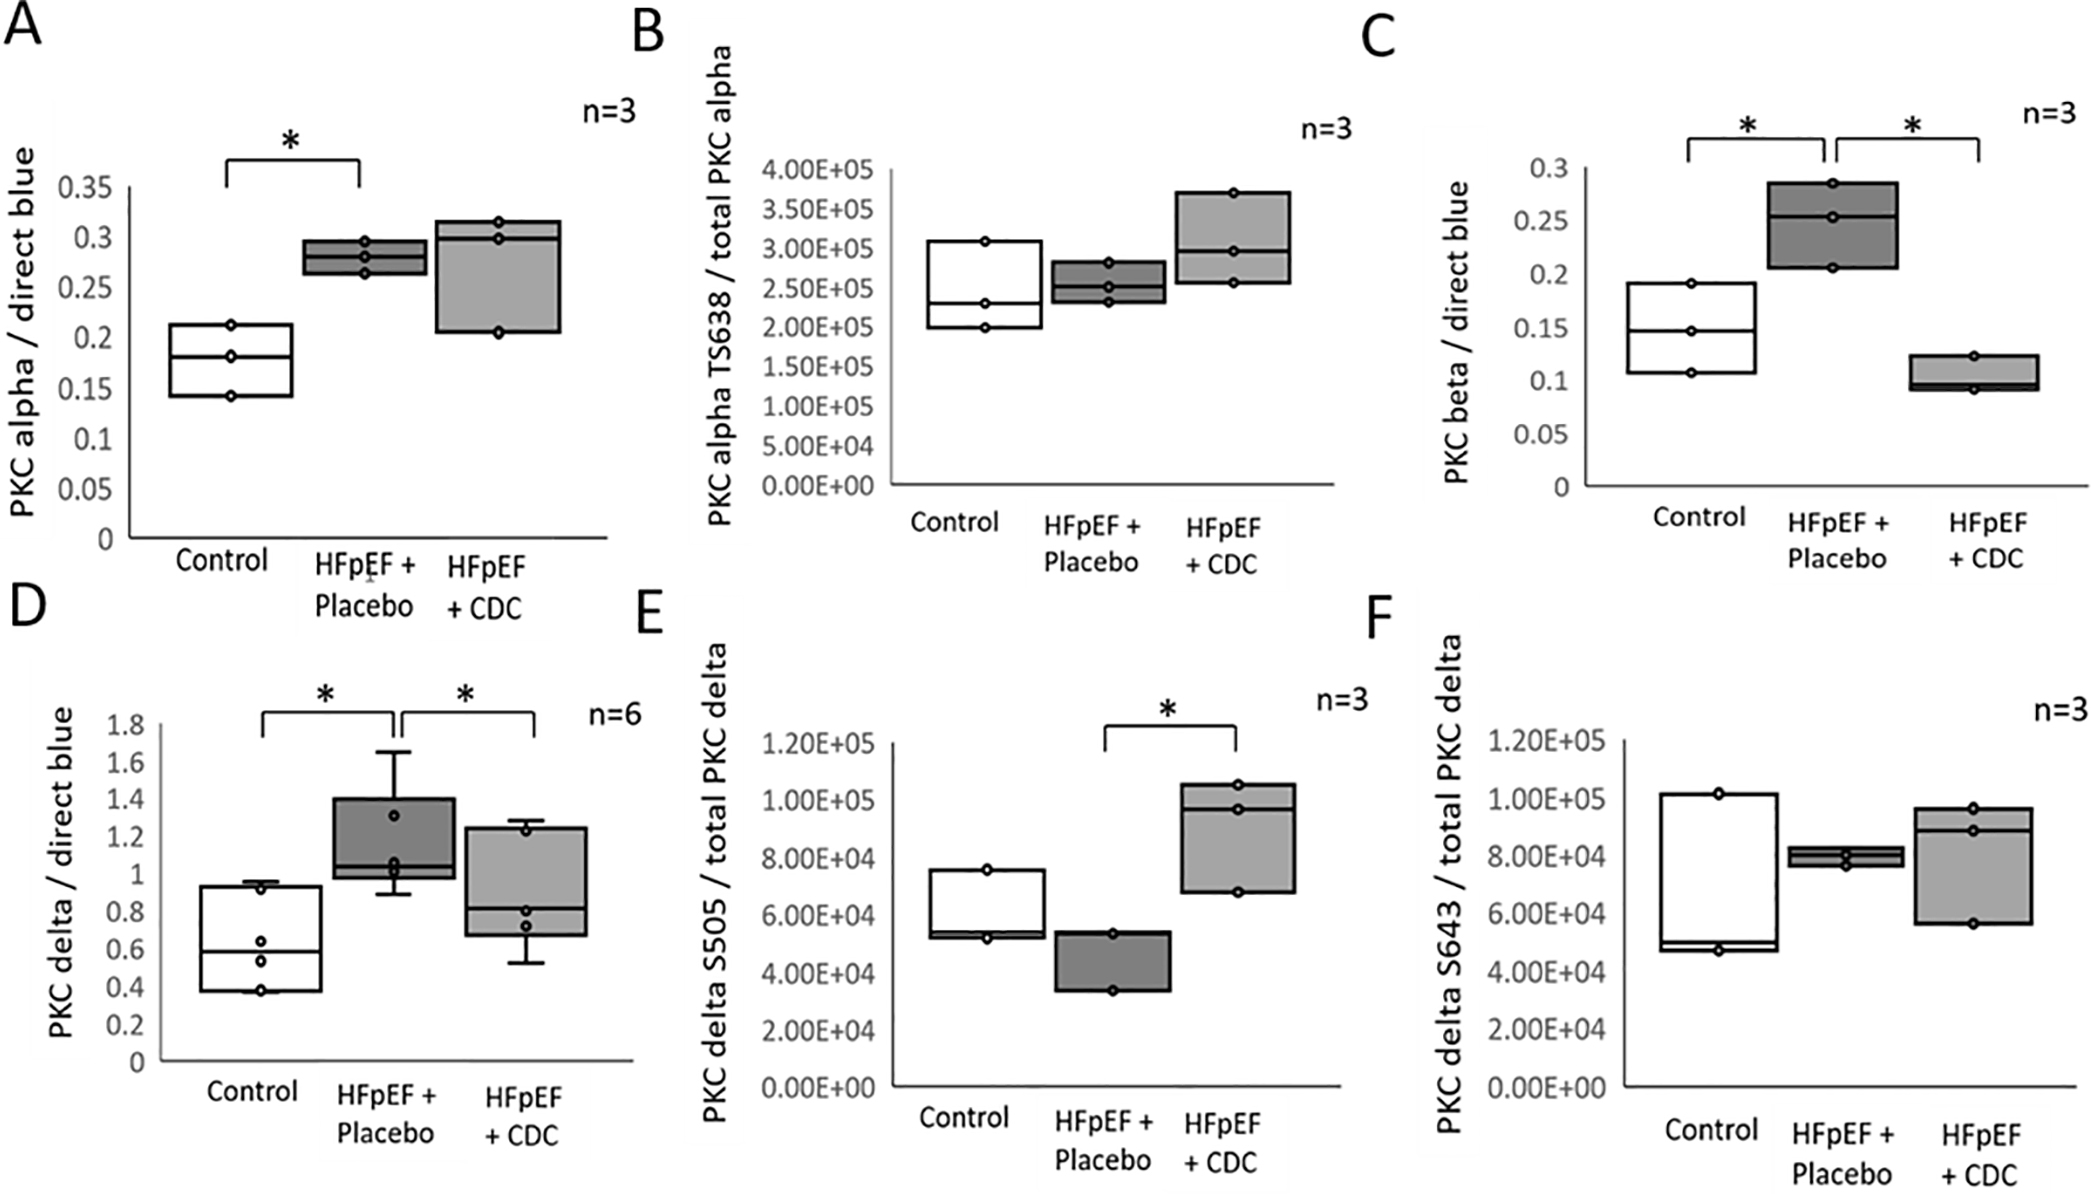
Figure 5:

Relative quantification of PKC kinase isoforms and their regulators. Western blots were performed for PKC α (A), β (C), and δ (D) the phosphorylation sites T638 of PKCα (B), S505 (E), and S643 (F) of PKCδ from the identical LV rat samples used for MS analysis. All intensities were normalized to total protein staining with direct blue. * indicates significance p≤0.05 among treatment groups tested with non-parametric Krustal-Wallis one-way ANOVA (n=6 for D, n=3 for A, B, C, E and F).
