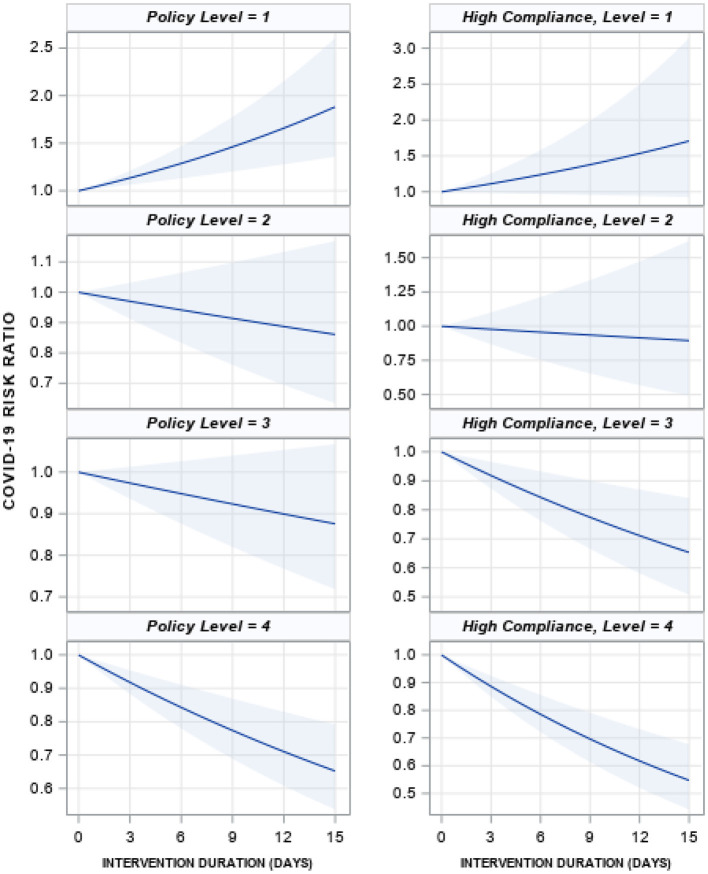
Figure 3.
Mean effect of each policy level on the COVID-19 case rate if the policy was implemented for 15 days, low and high compliance. The solid blue line is the mean effect size for each intervention with 95% confidence intervals (shaded blue). A value of 1 represents no change, 1.5 is a 50% increase in cases and 0.5 is a 50% decrease. The left column is for low compliance (no change in behavior in 2020 compared to 2019, scaled value 0) and the right is for high compliance (scaled value 8). Effect sizes are from negative binomial models reported in Supplementary Table B0.

