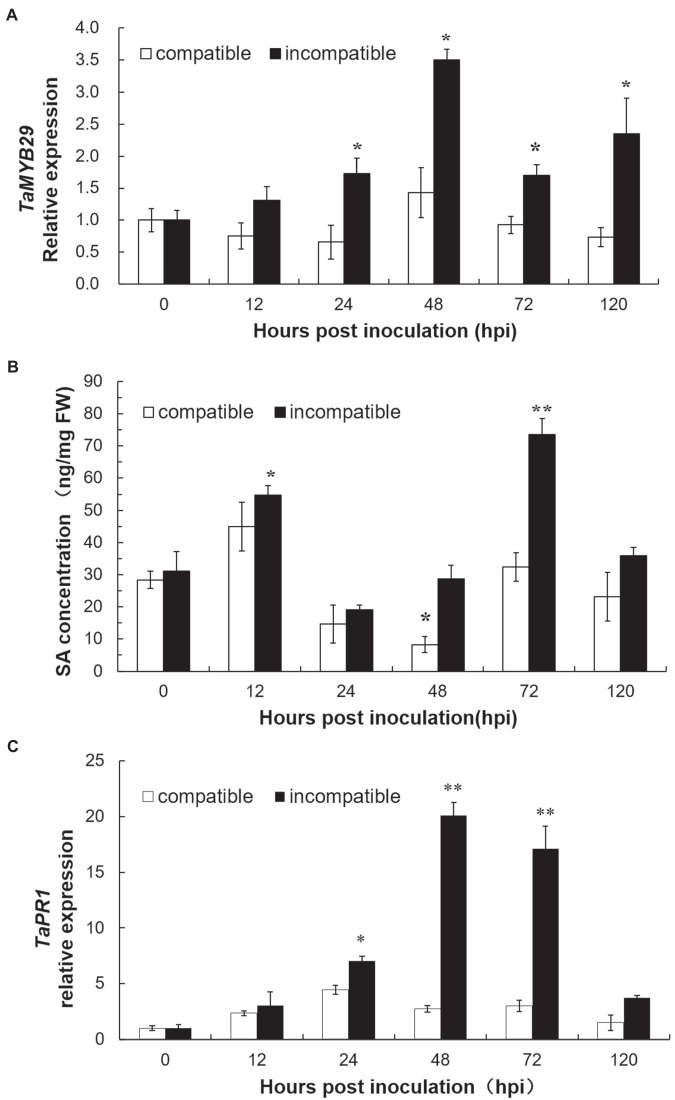
Figure 5.
The expression profiles of TaMYB29 (A) and TaPR1 gene expression (C) and salicylic acid (SA) concentration (B) in AvS and AvS+Yr10 wheat leaves during the time course of stripe rust infection. The leaves were sampled at 0, 12, 24, 48, 72, and 120h post-inoculation (hpi) with three biological experiments replicates. Error bars represent standard deviation among three biological replicates. Student’s t-tests were used to for the statistical analyses and the asterisks (∗) and (∗∗) indicate a significant difference between the particular time point and 0hpi with a value of p<0.05 and 0.01.

