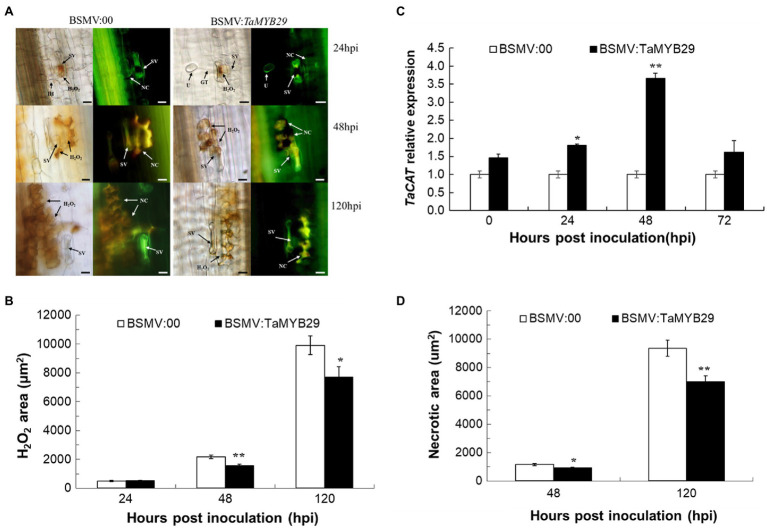
Figure 8.
Reactive oxygen accumulation and related gene expression and hypersensitive response in the TaMYB29 knockdown AvS+Yr10 wheat leaves. (A) The reactive oxygen species and cell necrosis in wheat leaves in response to Pst observed under a fluorescence microscope. (B) The reactive oxygen species areas were stained with DAB and measured microscopically at 24, 48, and 120hpi. H2O2 accumulation was significantly reduced in TaMYB29 silenced leaves compared to the control. (C) Transcriptional level of ROS-related gene TaCAT in AvS+Yr10 after TaMYB29-scilencing at four time points relative to the expression in BSMV:00. (D) Cell death was measured microscopically because of the auto-fluorescence of necrotic cells at 48 and 120hpi. The area of green auto-fluorescence reduced in TaMYB29-silenced wheat plant. Pictures were taken under an epifluorescence or light microscopy at 24, 48, and 120hpi, respectively. BSMV:00 is the control group and BSMV:TaMYB29 is the experimental group in which TaMYB29 gene was silenced. U, urediniospore; GT, germ tube; NC, necrotic cell; SV, substomatal vesicle; IH, initial hyphae; HMC, haustorial mother cell; and SH, secondary hyphae. Bars=20μm. Error bars represent standard deviation among three biological replications. Student’s t-tests were used to for the statistical analyses and the asterisks (∗) and (∗∗) indicate a significant difference between particular hpi and controls with a value of p<0.05 and 0.01, respectively.

