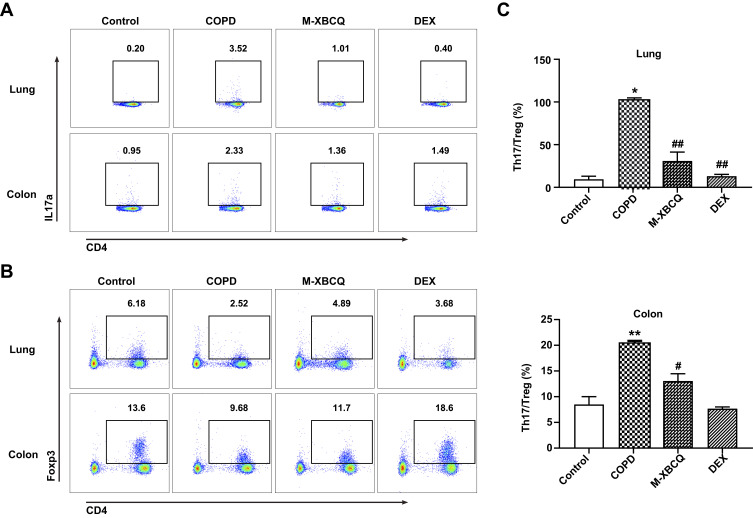
Figure 6.
Flow cytometry of Th17 and Treg cells in the lung and colon of COPD mice. The representative plots of Th17 cells gated by CD3+CD4+IL17+ (A). The representative plots of Treg cells gated by CD3+CD4+CD25+Foxp3+ (B). The Th17/Treg ratio in lung and colon (C). Data are expressed as mean ± SEM. **P < 0.01, *P < 0.05, compared with control group. ##P < 0.01, #P < 0.05, compared with COPD group.
Abbreviations: M-XBCQ, the middle dose of XBCQ; DEX, dexamethasone.

