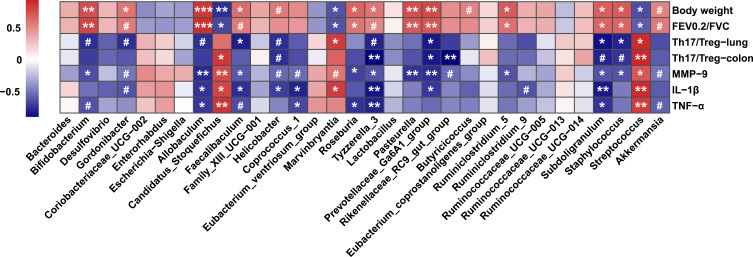
Figure 9.
Spearman correlation analysis between key genera and physiological parameters affected by experimental COPD. Cells are colored based on the Spearman correlation coefficient. The red indicates a positive correlation, and the blue indicates a negative correlation. Asterisks indicate statistically significant correlations, and hash signs indicate a significant correlation trend. ***P < 0.001, **P < 0.01, *P < 0.05, #P < 0.10.

