Figure 6.
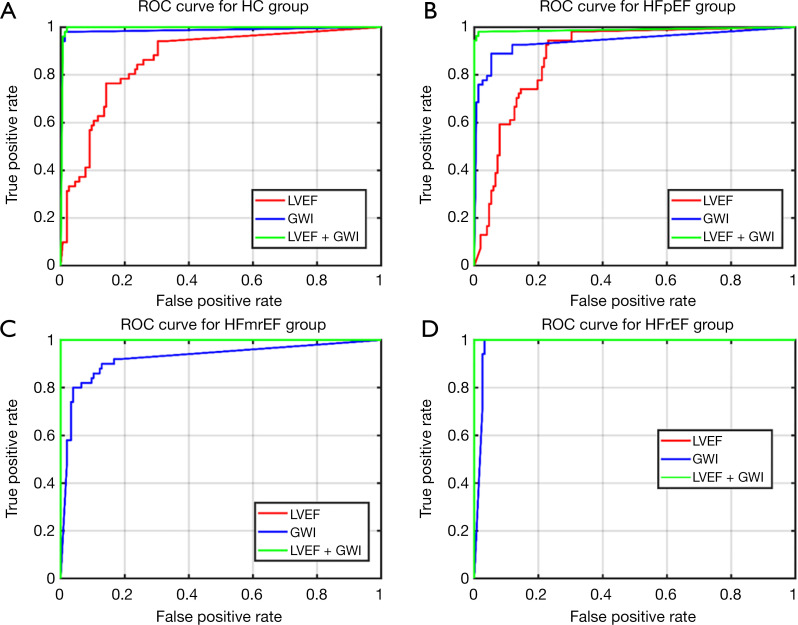
ROC curve analysis of multi-classifying HC, HFpEF, HFmrEF, and HFrEF groups, with a comparison of LVEF, GWI, and LVEF + GWI in each group. (A) ROC curves for the HC group. Area under the ROC curve (AUC) =0.86 using LVEF; AUC =0.98 using GWI; and AUC =0.99 using LVEF+GWI. (B) ROC curves for the HFpEF group. AUC =0.88 using LVEF; AUC =0.94 using GWI; and AUC=0.99 using LVEF + GWI. (C) ROC curves for the HFmrEF group. AUC =0.99 using LVEF; AUC =0.92 using GWI; and AUC =0.99 using LVEF + GWI. (D) ROC curves for the HFrEF group. AUC =0.99 using LVEF; AUC =0.98 using GWI; and AUC =0.99 using LVEF + GWI. In (C) and (D), the ROC curve of “LVEF (red)” was overlapped with the “LVEF + GWI (green)”. HC, healthy control; HFpEF, heart failure with preserve ejection fraction; HFmrEF, heart failure with mid-range ejection fraction; HFrEF, heart failure with reduced ejection fraction; ROC, receiver operating characteristic; AUC, area under the ROC curve; LVEF, left ventricular ejection fraction; GWI, global MW index.

