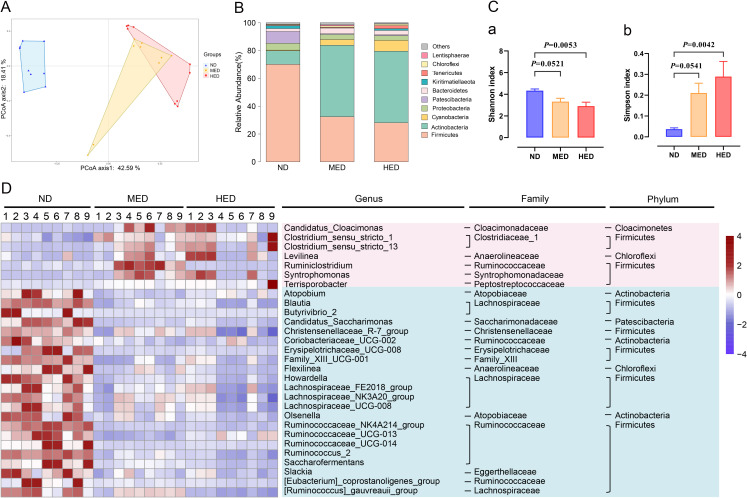
Figure 3.
Profiling of the gut microbiota was altered in a MetS model. (A) Bray-Curtis principal coordinate analysis (PCoA) plot of gut microbiota based on the operational taxonomic unit metrics of the samples in the ND, MED and HED groups (n=9). (B) Bacterial taxonomic profiling at the phylum level of intestinal bacteria from different treated groups. (C) (a) Shannon index and (b) Simpson index of gut microbiota in three treated groups. (D) Heatmap of differential abundance from the MED and HED groups compared with the ND group. The color of the spots in the left panel represents the relative abundance at the genus level in each group. HED, high-energy diet; MED, medium-energy diet; MetS, metabolic syndrome.

