Figure 1.
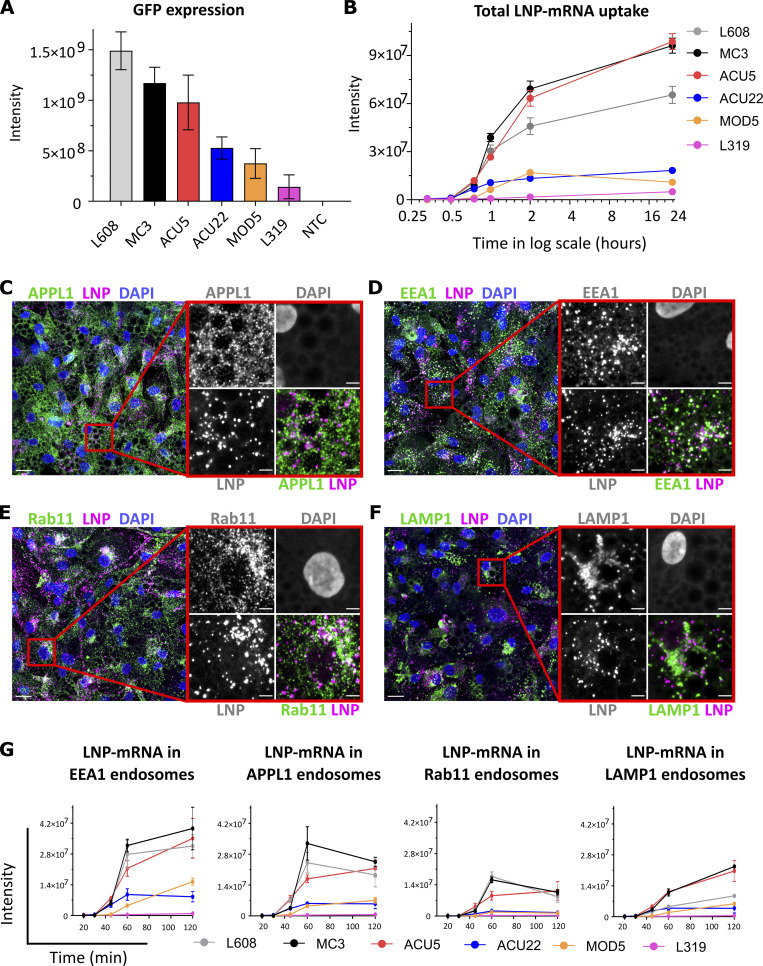
Comparative analysis of activity, endocytic uptake, and endosomal distribution of six LNP-mRNAs in primary human adipocytes. (A) Cells were incubated with various LNPs (1.25 ng/μl) formulated with eGFP-mRNA, fixed, and imaged after 24 h. The graph illustrates GFP expression for the indicated LNP-mRNA. n = 3 independent experiments (mean ± SEM). (B) Representative LNP-mRNA uptake kinetics curve. Cells incubated with LNP-mRNA as described above were fixed at the given time point, processed for smFISH to fluorescently label mRNA, and imaged by fluorescence microscopy. The quantification shows that LNP-mRNA uptake generally correlates to the GFP expression efficacy of LNP formulations displayed in A (e.g., MC3 versus L319). (C–F) Representative images of human primary adipocytes incubated with L608 LNP-mRNA for 2 h and immunostained with antibodies against endosomal markers (in green) as follows: APPL1 (C), EEA1 (D), Rab11 (E), and LAMP1 (F). Exogenous mRNA was detected by smFISH (labeled as LNP) and nuclei by DAPI. The magnified area is presented with split and merged color images. Scale bars are 20 μm in the overview and 5 μm in the magnified images. (G) Representative kinetics and endosomal distribution of the different LNP-mRNAs incubated with cells as described in C–F. n = 3 replicates (mean ± SEM). Significant P values for panels A, B, and G and for all LNP combinations are listed in Table S4, Table S5, Table S6, Table S7, Table S8, and Table S9.

