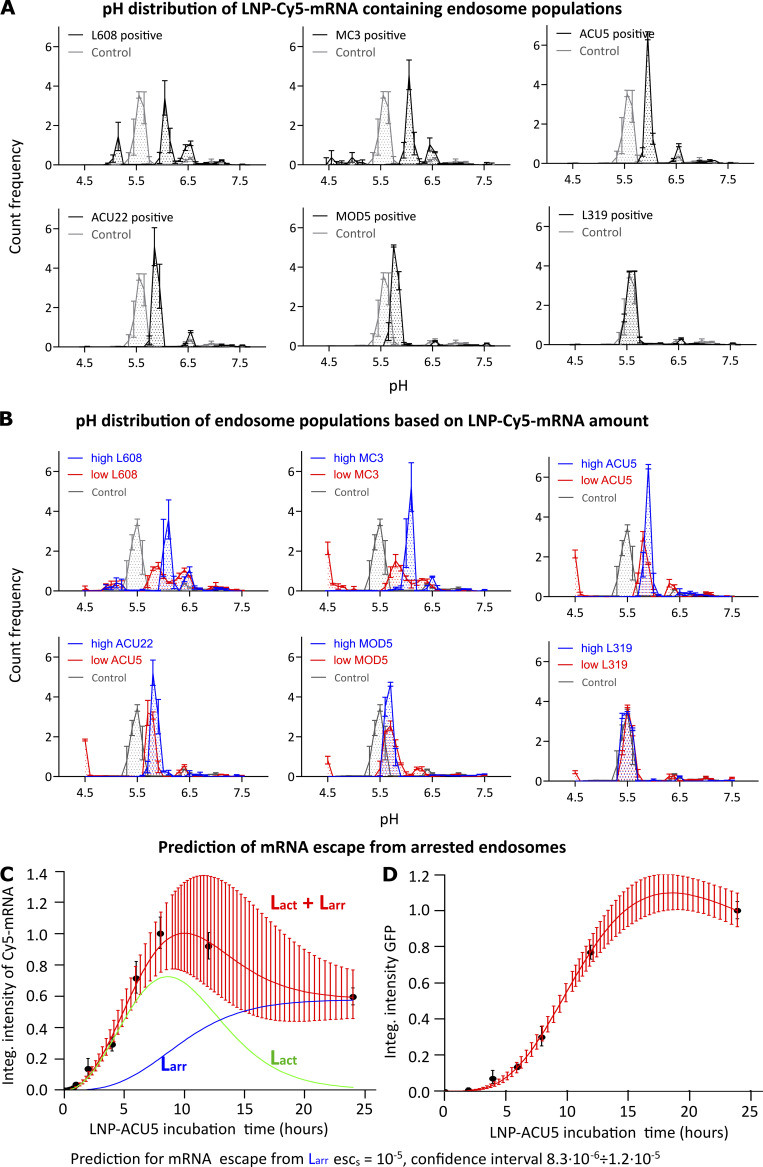
Figure 3.
Endosomes accumulating LNP-Cy5-mRNA display acidification defects and negligible endosomal mRNA escape. (A) HeLa cells were incubated with pH Rodo-Red and pH stable Alexa Fluor 488 fluorophore-labeled LDLs with and without LNP-Cy5-mRNA for 2 h and imaged live. The pH of LNP-Cy5-mRNA–containing endosomes was calculated by intensity ratiometric analysis from LDL-pH Rodo-Red and LDL-Alexa Fluor 488 (see Materials and methods). Whereas in control cells (LDL probes internalized without LNP-Cy5-mRNA, gray line), a significant proportion of endosomes was acidified to pH 5.5, characteristic of late endosomes/lysosomes, most LNP-Cy5-mRNA–containing endosomes (black line) stalled between early (pH 6.5) and late endosomal (pH 5.5) pH. (B) The graph illustrates pH distribution in endosome populations based on their LNP-Cy5-mRNA accumulation (high versus low). Endosomes with a high amount of LNP-Cy5-mRNA show higher pH (blue line, prominent in L608 and MC3, less prominent in ACU5 and ACU22, no difference in MOD5 and L319) than those with low LNP-Cy5-mRNA (red line). (C and D) Mathematical model for prediction of mRNA escape from arrested (Larr) endosomes in human primary adipocytes. The theoretical model fit (red lines in C and D) to experimental ACU5 LNP-Cy5-mRNA uptake kinetics (C, black dots) and GFP expression (D, black dots). Green and blue lines denote model predictions for active (Lact) and Larr endosomes, respectively (see Materials and methods; Supplemental figures, Fig. S5, A and B). Experimental points and error bars in A and B indicate mean ± SEM of three independent experiments. The error bars in C and D represent the 95% confidence interval on the theoretical curves (red) estimated by uncertainty distribution approximation by normal distribution with inverse Hessian of likelihood as a covariance matrix. Integ., integral.

