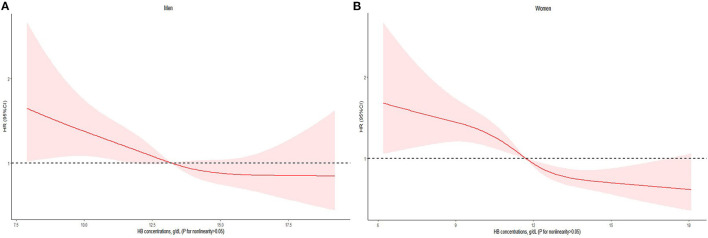
Figure 3.
HB on a continuous scale and risk of all-cause mortality in the older adults form Chinese longevity regions stratified by sex: (A) men, (B) women. Cox models with restricted cubic spline curves adjusted for age, education time, marital status, residence, economic status, smoking status, drinking status, tea drinking, food diversity score, regular exercise, ADL, self-reported diagnosed hypertension, diabetes, stroke, heart disease, MMSE score, depressive symptom score, BMI, CRP, eGFR, WBC count, MCV, platelet count, and TC.

