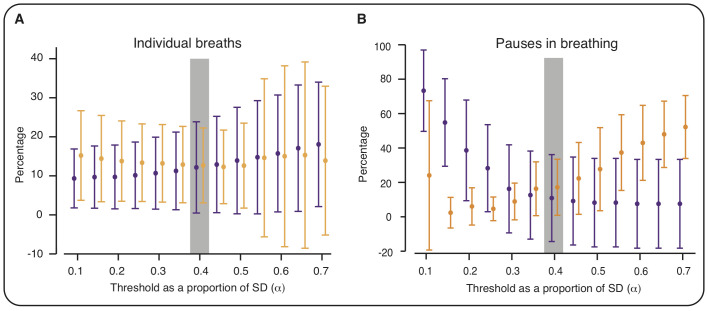
Figure 2.
Optimising the threshold for breath detection. To optimise the threshold parameters, we investigated the performance of different threshold values (defined as a multiple (α) of the SD of the IP signal across the previous N breaths) to identify individual breaths and pauses in breathing. Figures show the percentage of false positives (orange) and false negatives (purple) for different values of α (with N=15). (A) Values calculated by comparing algorithm-identified breaths with breaths manually annotated at the time of the recording by visual observation (data set 1). (B) Values calculated by comparing algorithm-identified pauses in breathing with pauses (of at least 5 s) manually annotated by two investigators (first hour of recording in 15 infants from data set 2). Error bars indicate mean and SD (across the recordings). Values are jittered on the X-axis so that false positive and false negative bars do not overlap. Grey shading indicates selected threshold parameters; with these parameters (α=0.4, N=15), there was the optimal balance between the percentages of false positives and false negatives in the identification of individual breaths (A). These parameters also achieved a good balance between false positives and negatives in the identification of pauses in breathing (B).

