Figure 3.
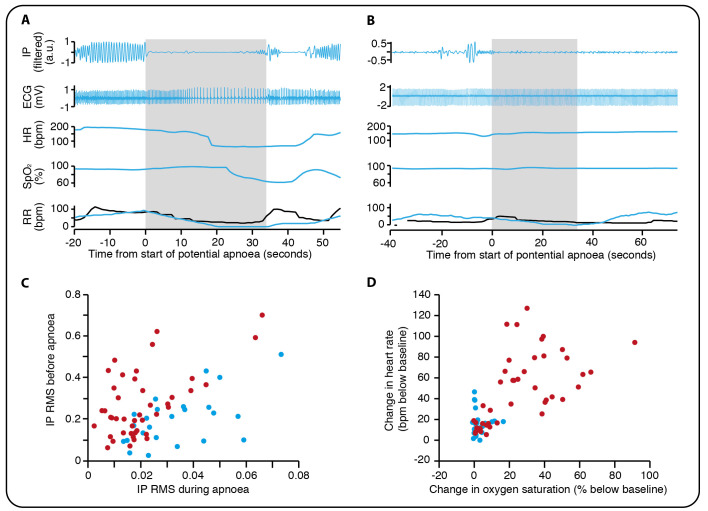
Using support vector machine classification to identify true apnoeas. (A) An example of a pause in breathing lasting longer than 20 s identified as a true apnoea. IP, the electrical impedance pneumograph after filtering to remove cardiac-frequency noise and movement artefact. HR, heart rate in beats per minute. SpO2, oxygen saturation. RR, respiratory rate in breaths per minute, recorded by the infant’s patient monitor (black) and calculated using our algorithm (blue). Note that the RR does not reach zero on the infant’s patient monitor and so this episode does not lead to a monitor apnoea alarm. Grey shading indicates the period during which no breaths were detected by our algorithm. (B) A potential apnoea initially detected by the algorithm but classified by investigators as a false alarm. (C) The root mean square (RMS) of the IP signal before and during the apnoea (see Methods for further details). Red circles indicate episodes classified by both investigators as true apnoeas, and blue circles are those episodes classified by both investigators as false alarms. (D) Change in oxygen saturation and heart rate for true apnoeas (red) compared with false alarms (blue).

