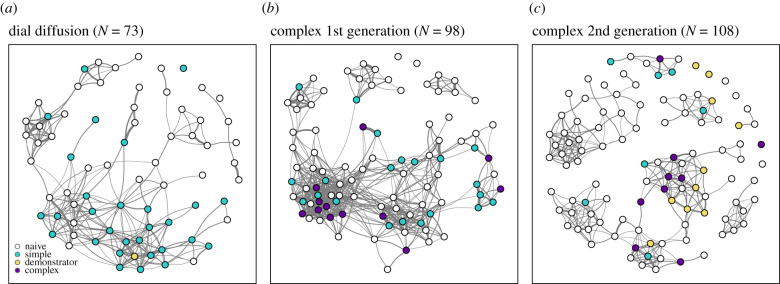
Figure 2.
Social association networks at subpopulation BB (a) for the dial diffusion, (b) for the complex first generation experiment and (c) for the complex second generation experiment. Nodes represent individual birds and are coloured according to state of knowledge. Links between nodes represent the strength of the connection between two individuals. Yellow nodes are knowledgeable demonstrators (either trained in captivity or solving in the previous generation), white nodes are naïve individuals. All other nodes are coloured according to their final knowledge state gained, with blue = dial/slide, and purple = complex solvers. (Online version in colour.)

