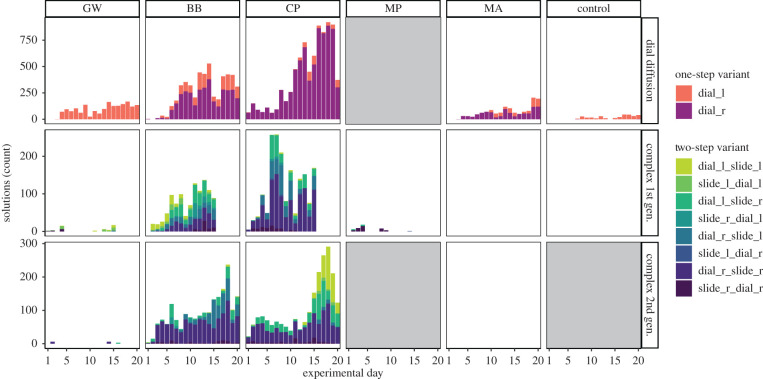
Figure 3.
Overview of diffusion and production of solutions across subpopulations and experiments. Solution variants are coloured, and while one-step solutions (dial and slide) continued to be produced in the complex first and second generation experiments, for ease of viewing, only two-step solutions are shown in these stages. GW and BB were initially seeded with ‘dial L’ (counter-clockwise), while CP and MA were seeded with ‘dial R’ (clockwise). The height of bars represent the number of total solutions produced per day by all birds. Experimental day is shown on the x-axis, ranging from 1–20 in dial and complex second generation experiments, and 1–15 in the complex first generation experiment. NB: As there were no knowledgeable birds present to act as demonstrators in MA in the complex second generation experiment, it was used as the control site. (Online version in colour.)

