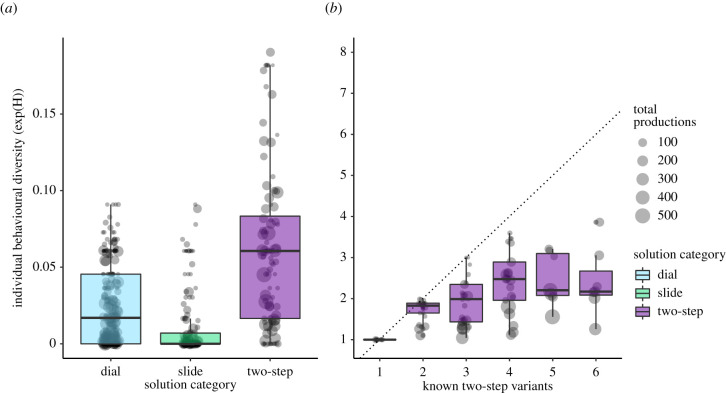
Figure 4.
Behavioural diversity in solving techniques. Lower values indicate that an individual preferred fewer solutions, with the number of solutions preferred correlating to the integer value of the score. Each point represents an individual's behavioural productions (size: number of productions), median and quantile values denoted by the box plot. (a) Individuals were relatively faithful to their slide and dial variants (dial: median = 1.37; slide: median = 1). Most individuals preferred to produce two out of eight possible two-step variants (median = 1.89). (b) Overview of the same measure of individual behavioural uncertainty, compared across how many variants an individual produced over both complex first and second generation experiments. The dotted diagonal line indicates the maximum behavioural diversity score possible if an individual produced all known behaviours with equal frequency. Individuals continued to prefer between two and three two-step variants, even as their number of known variants increased. (Online version in colour.)

