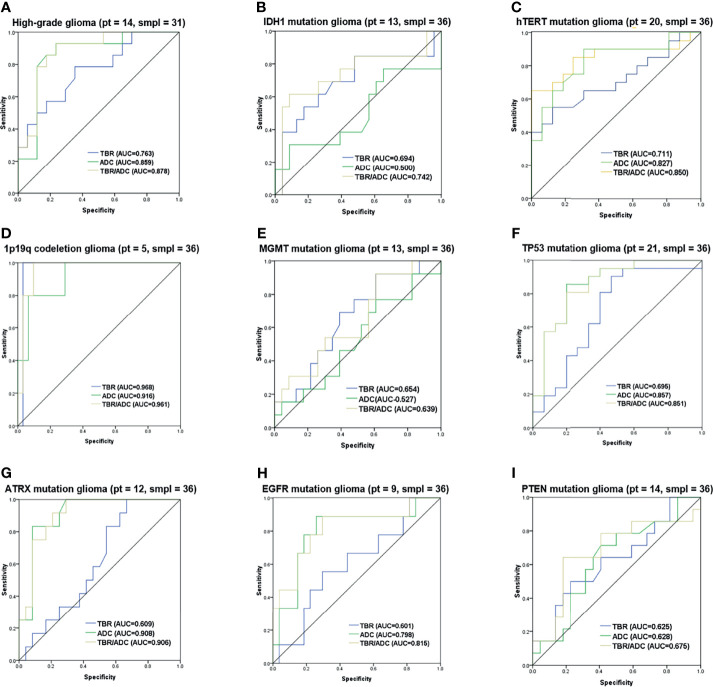
Figure 6.
Receiver operating characteristic curves of 18F-FET PET, and DWI imaging combination. ROC curves with the AUC of the optimal imaging combinations in yellow, FET-PET in blue and DWI in green in cyan for (A) grading, (B) IDH1 mutation, (C) hTERT mutation, (D) 1p/19q codeletion, (E) MGMT mutation, (F) TP53 mutation, (G) ATRX mutation, (H) EGFR mutation and (I) PTEN mutation. The number of patients and samples of each ROC analysis is displayed in the title.

