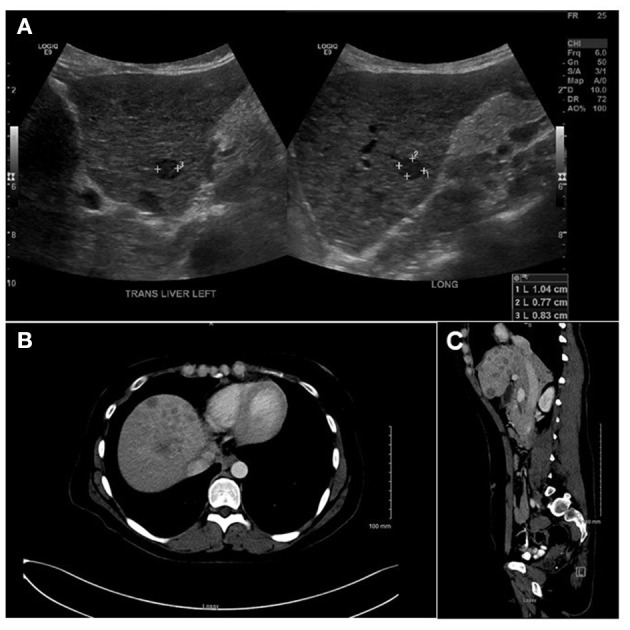
Figure 2.

(A) Liver ultrasound showing multiple hypo-echoic lesions ranging between 0.5 and 3.3 cm. (B) A liver computerized tomography scan showing multiple hypo-echoic lesions with peripheral rim of increased enhancement. (C) A magnetic resonance imaging (sagittal view) showing same as (A,B).
