Figure 5.
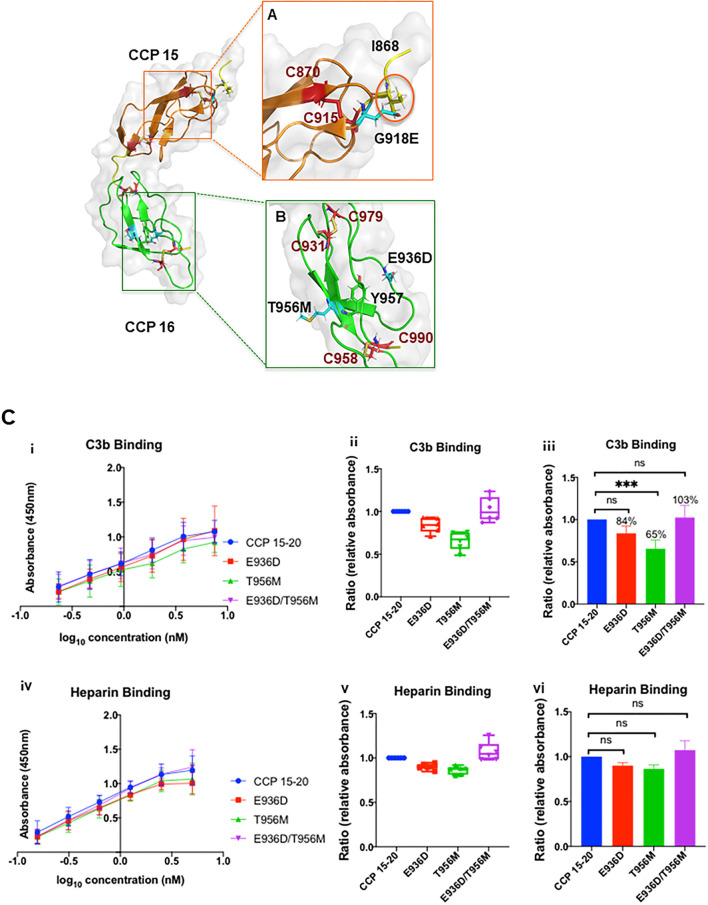
Structural analysis of G918E, E936D, and T956M. Nuclear magnetic resonance spectroscopy solution structure of CCP 15–16 (PDB ID: 1HFH) (32). (A) The highest frequency rotamer of the G918E side chain and its clashing residue I868 is highlighted in the orange circle. (B) The highest frequency rotamer of the T956M and E936D side chains is highlighted in cyan. C958 and C990 form a disulfide bond next to the Y957 residue to stabilize the CCP 16 tertiary structure. E936D and T956M are located on the protein surface, spatially distant from the disulfide bond. CCP 15 (orange); CCP 16 (green); linker between CCP 15 and 16 (yellow); cysteine side chains involved in disulfide bond formation (red); G918E, E936D, and T956M variants (cyan sticks, zoomed and reoriented in inset box). Functional analysis of T956M and E936D. (C) (i, iv) Absorbance is plotted against logarithmic protein concentrations. (ii, v) Box-and-whisker plots demonstrating C3b and heparin binding (by ELISA) of E936D, T956M, and combined variant E936D/T956M compared to WT. (iii, vi) Representation of C3b and heparin binding of E936D, T956M, and E936D/T956M compared to WT using bar graphs. Compared to WT there was no difference in heparin binding for E936D, T956M, or E936D/T956M. T956M showed ~35% decrease in C3b binding compared to WT (P < 0.001). Data represent three separate experiments with bars corresponding to SEM. ***P < 0.001.

