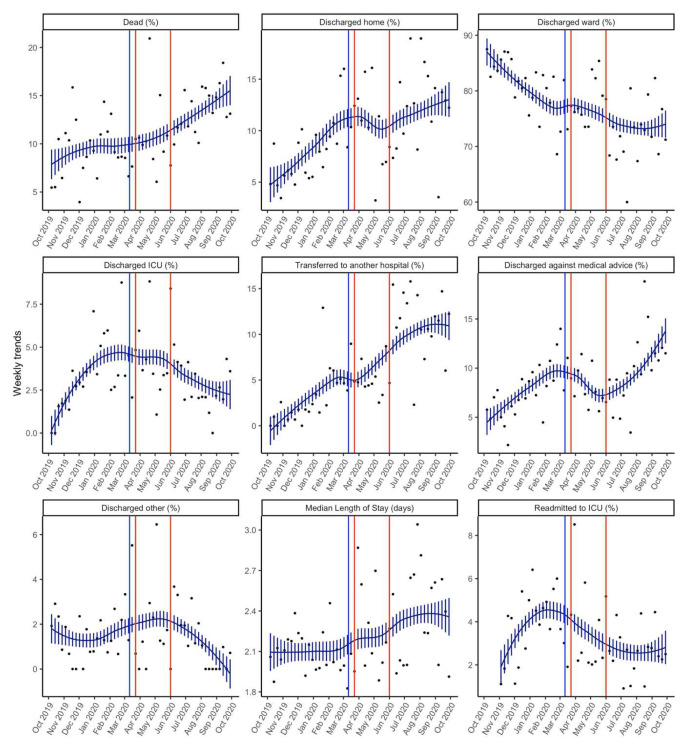
Figure 3. Smoothed weekly trends of outcomes.
The dots are the original data, and the lines and bars are loess predictions and standard errors. The blue line represents March 11 th 2020, the date the WHO declared COVID-19 as a pandemic. The brown lines indicate the intense lockdown period in India from 23 rd March 2020– 1 st June 2020.

