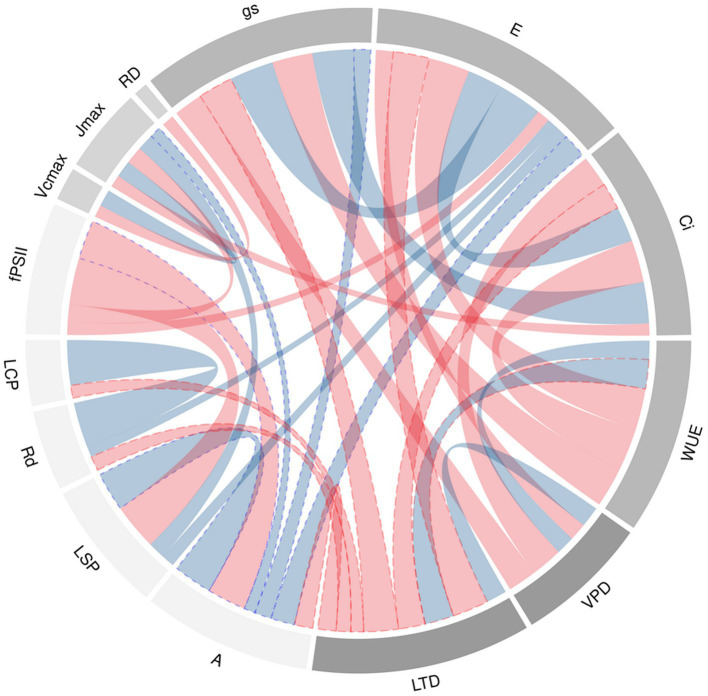
Figure 4.
Chord diagram of correlation coefficients between agronomic and physiological traits at leaf level of 64 genotypes of bean grown under conditions of high temperatures. The ribbons within the circle correspond to significant correlations with a p<0.05. The red ribbons indicate negative coefficients and the blue ribbons indicate positive coefficients. The ribbons with blue and red dotted lines are the relationship of A and LTD to the different variables whose correlation was statistically significant. The acronyms are described in Table 1.

