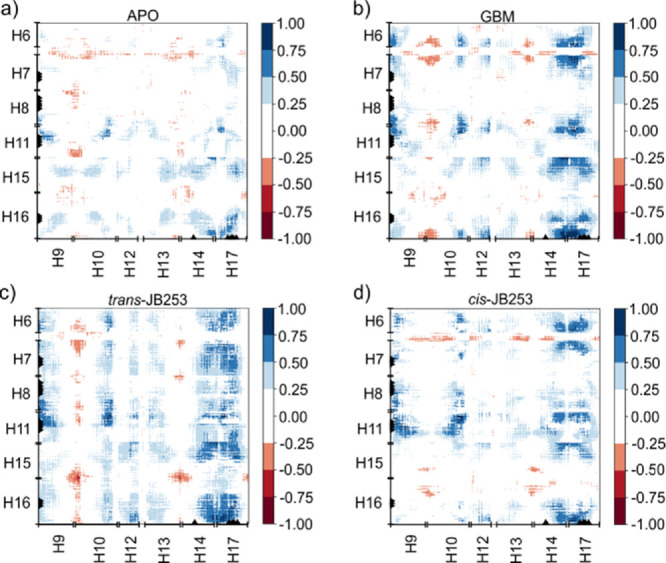
Figure 2.

Correlation matrices calculated from 5 × 200 ns MD trajectories data for (a) APO, (b) GBM-SUR1, (c) trans-JB253-SUR1, and (d) cis-JB253-SUR1 systems. The horizontal axis corresponds to L2 (helices H9, H10, H12, H13, H14, and H17), while the vertical axis corresponds to helices forming L1 (H6, H7, H8, H11, H15, and H16).
