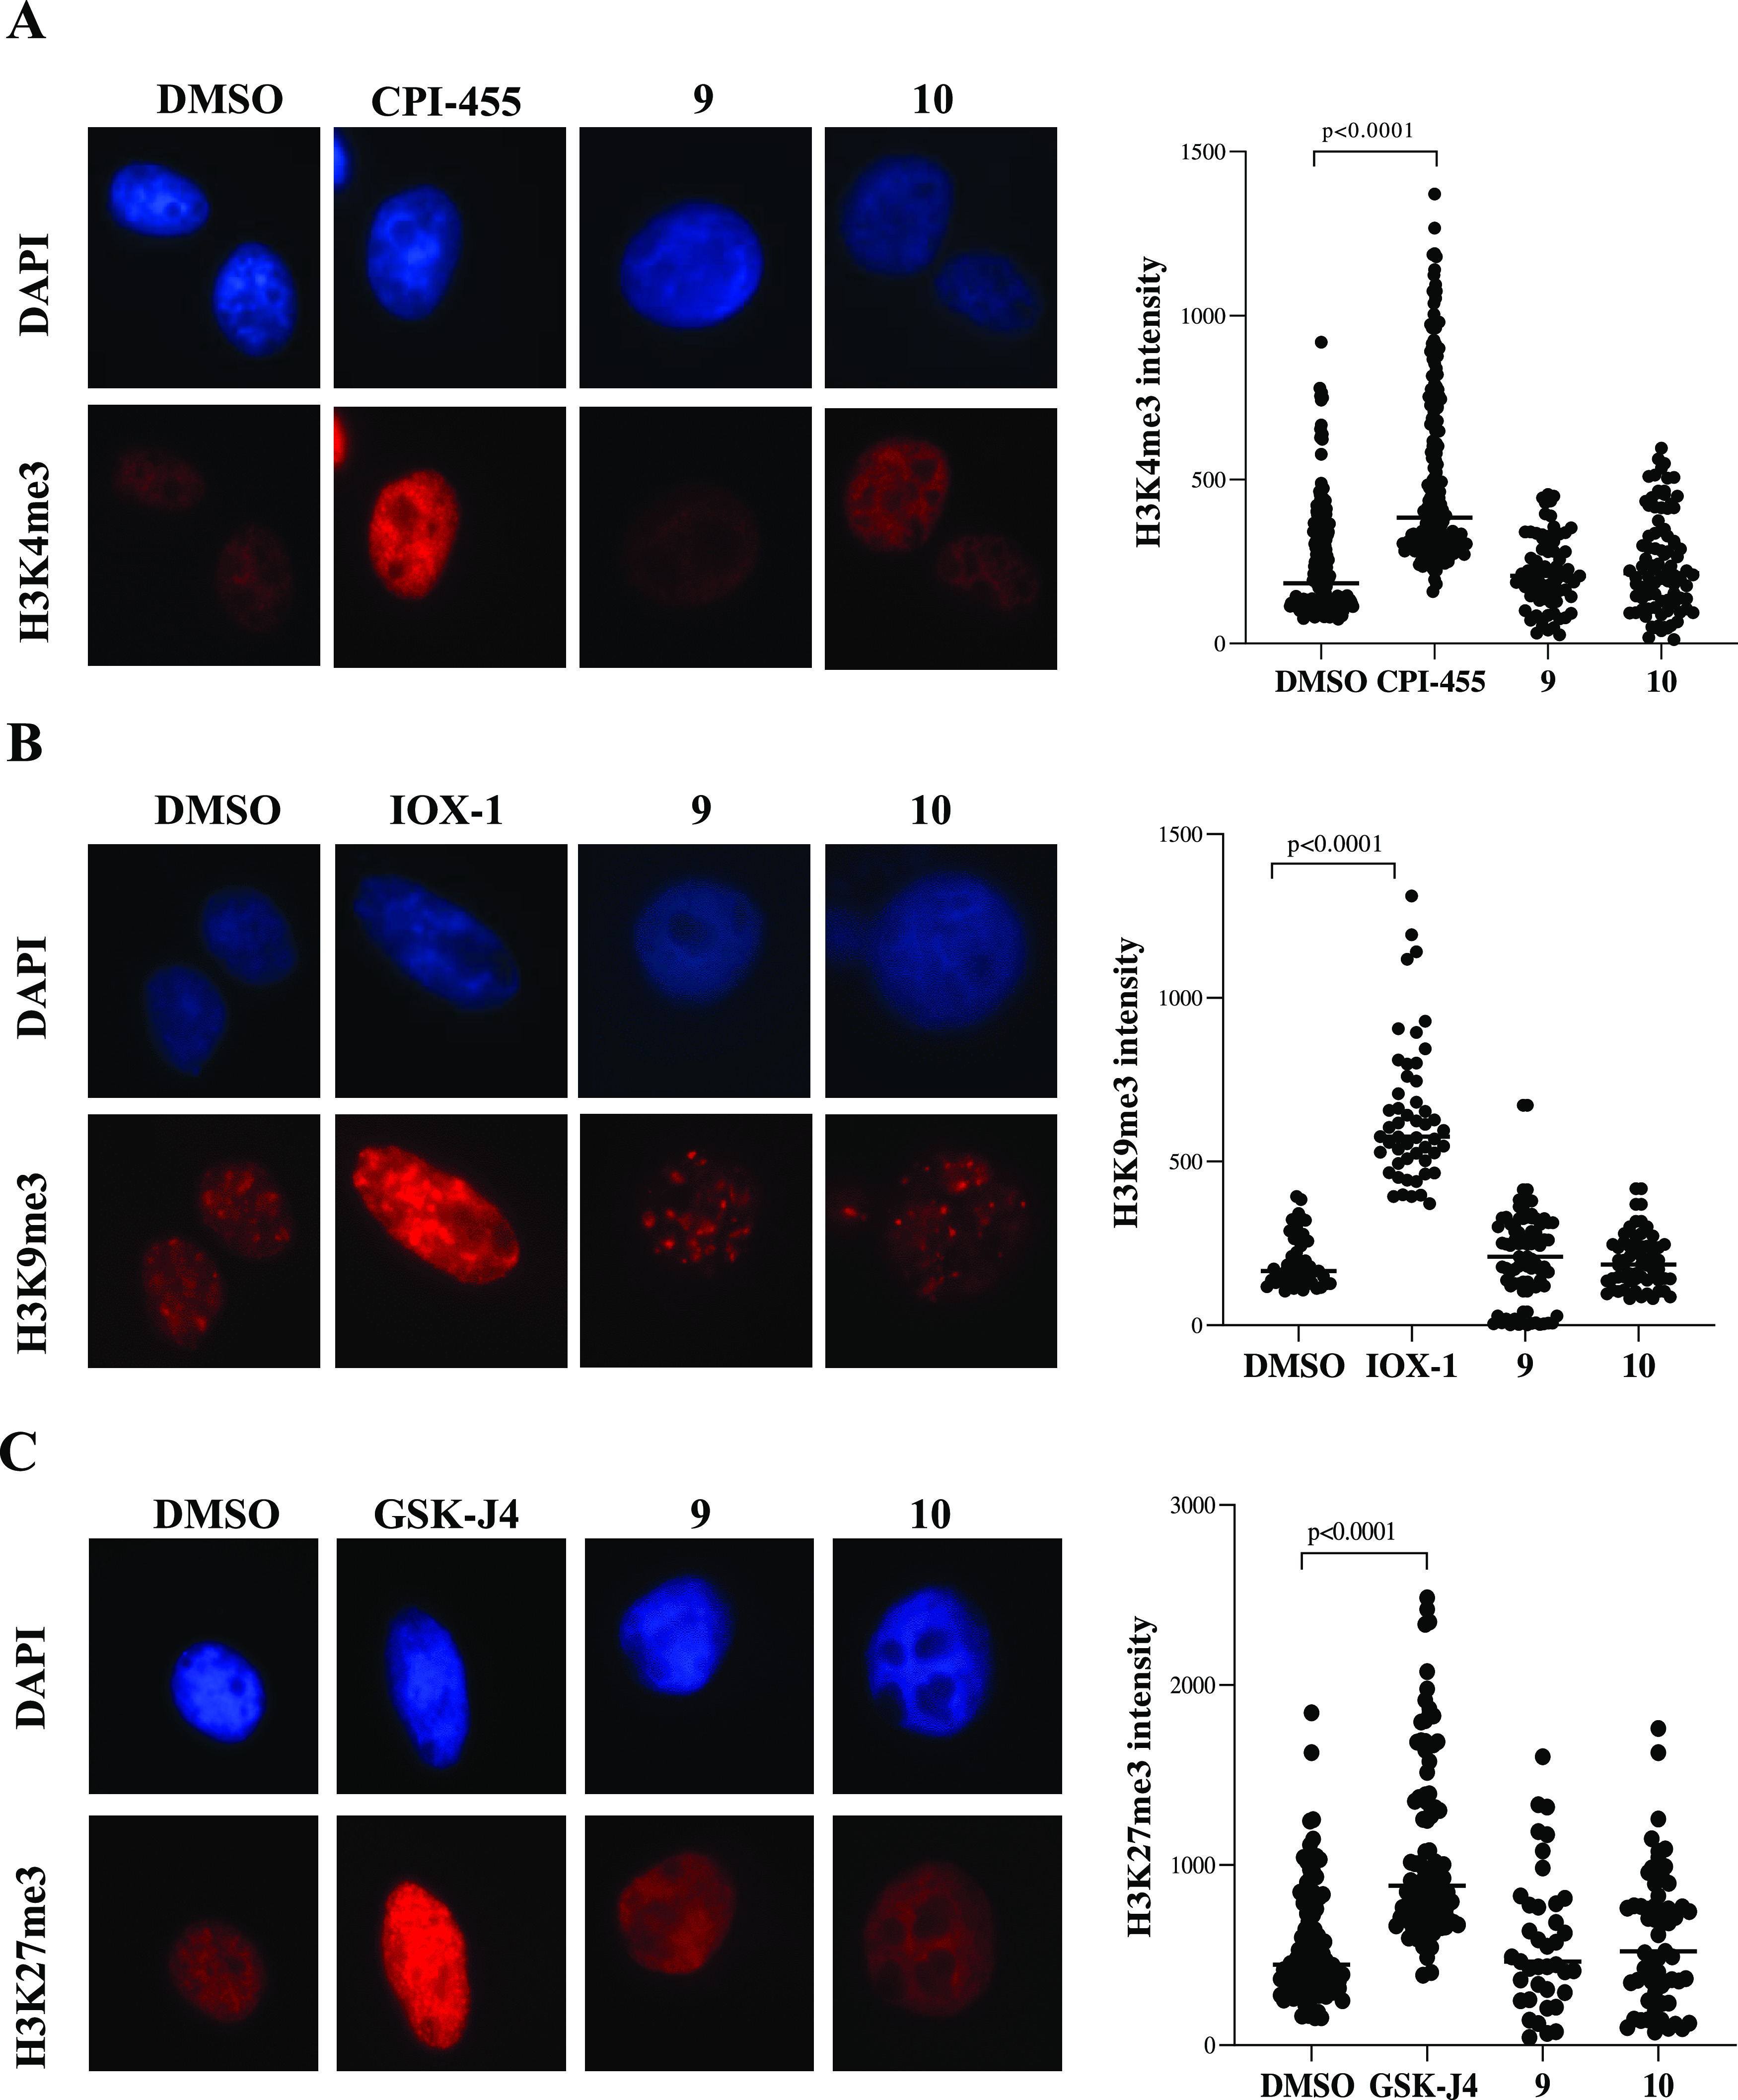
Figure 8.

Cellular selectivity of 9 and 10 over representative KMDs. (A) Representative immunofluorescence analysis of the level of histone methyl mark H3K4me3 (left panel) and relative fluorescence intensity quantification in U-87MG cells treated with CPI-455 (25 μM, as a positive control for KDM5 inhibition) or with 9 and 10 (50 μM) for 48 h. (B) Representative immunofluorescence analysis of the level of histone methyl mark H3K9me3 (left panel) and relative fluorescence intensity quantification in U-87MG cells treated with IOX-1 (100 μM, as a positive control for KDM4 inhibition) or with 9 and 10 (50 μM) for 48 h. (C) Representative immunofluorescence analysis of the level of histone methyl mark H3K27me3 (left panel) and relative fluorescence intensity quantification in U-87MG cells treated with GSK-J4 (10 μM, as a positive control for KDM6 inhibition) or with 9 and 10 (50 μM) for 48 h. (A–C) Scatter plot (right side) illustrates the quantification of the specific histone methyl mark signal intensity in at least 50 counted cells per condition. The statistical analysis compares CPI-455 treatment vs DMSO control, IOX-1 treatment vs DMSO control, GSK-J4 treatment vs DMSO control (p < 0.0001, Mann Whitney test), and MINA53 inhibitor treatment vs DMSO control (no significance, Mann Whitney test).
