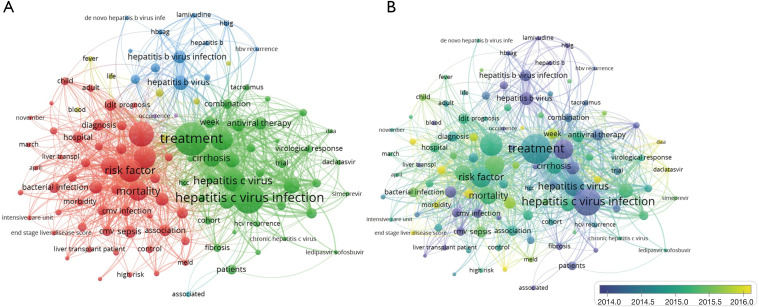
Figure 3.
Bibliometric network of terms from title and abstracts. (A) Bubble network map of the theme terms; (B) bubble overlay map of the research topics. The bubble size represented the appearances of theme terms (A,B). The distance between bubbles exhibited their occurrence frequency. In map A, colors were used to distinguish terms clusters, while in map B, colors indicated average publication time.

