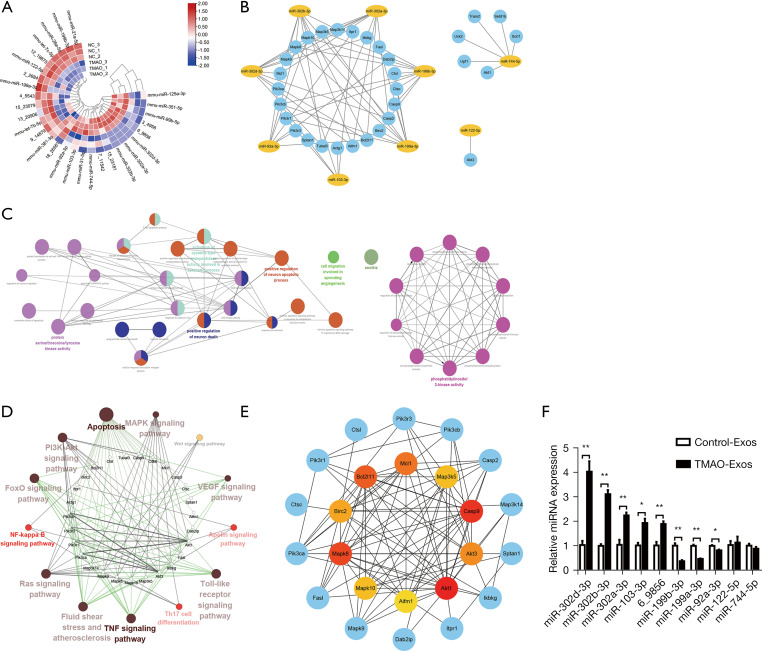
Figure 6.
The expression profiles of miRNAs in Exos, the prediction of miRNA-mRNA network, and bioinformatics analysis. (A) The differentially expressed miRNAs were visualized on a heatmap. (B) The known miRNAs and another unknown with the highest expression were selected for further analysis. Thirty-one target genes were predicted to interact with the differentially expressed miRNAs (except 6_9856). (C) The interacting networks among the GO biological processes were constructed using ClueGO of Cytoscape. (D) The interactions among the KEGG pathways were constructed using ClueGO. (E) Protein-protein interaction networks were constructed using the STRING database, and Mcl1, Bcl2l11, Birc2, Mapk8, Mapk10, Aifm1, Akt1, Akt3, Casp9, and Map3k5 were identified as the top 10 hub genes. (F) Compared to the Control-Exos, miR-302d-3p, miR-302b-3p, miR-302a-3p, miR-103-3p, and 6_9856 (prediction) were confirmed to be up-regulated, and miR-199b-3p, miR-199a-3p and miR-92a-3p were confirmed to be down-regulated. All the data are expressed as mean ± SEM. n=3, independent t-tests were performed for comparisons; *, P<0.05; **, P<0.01. TMAO, trimethylamine-N-oxide; Exos, exosomes; GO, Gene Ontology; KEGG, Kyoto Encyclopedia of Genes and Genomes; SEM, standard error of the mean.

