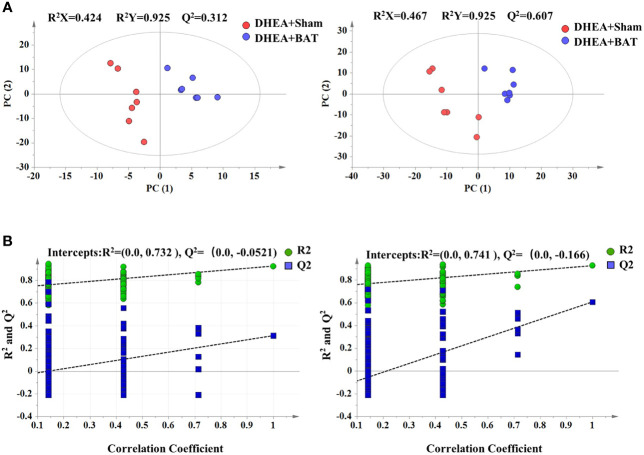
Figure 4.
Score plot of the PLS-DA model. (A) Score plot of the PLS-DA model in the positive and the negative mode. (B) Permutation test of the PLS-DA model in the positive and the negative mode. Green dots indicate R 2 and blue dots indicate Q 2. PLS-DA, partial least squares discriminant analysis.

