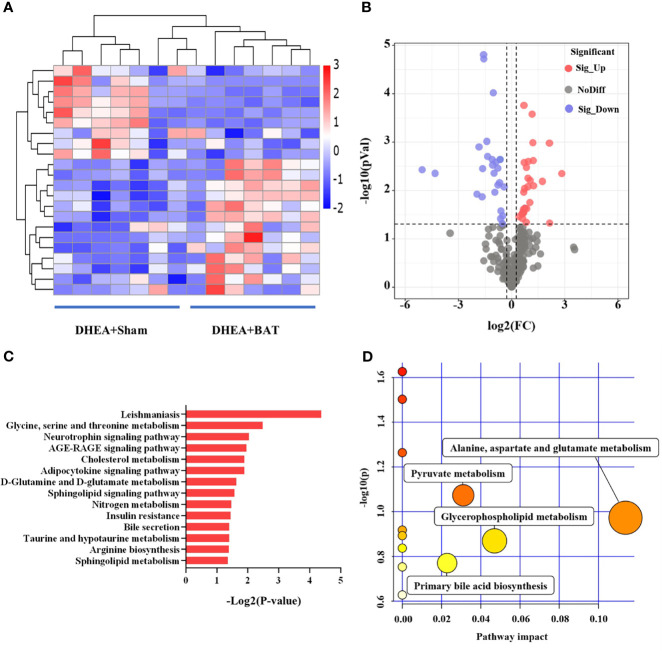
Figure 5.
Differential analysis of the metabolites in brown adipose tissue (BAT) from the DHEA+Sham and DHEA+BAT groups. (A) Heatmap of the 22 metabolites that were differentially expressed between the DHEA+Sham (n = 7) and DHEA+BAT (n = 7) groups. Blue to red equates to an increase in metabolite expression. (B) Volcano plot of all metabolites expressed in the DHEA+Sham and DHEA+BAT groups. (C) KEGG pathway analysis of the differentially expressed metabolites. (D) All matched pathways are displayed as circles analyzed with MetaboAnalyst 3.0. Potential target pathways were selected either by impact values from pathway topology analysis or by negative log p-values from pathway enrichment analysis. The size of the bubble represents the number of metabolites enriched. KEGG, Kyoto Encyclopedia of Genes and Genomes.

