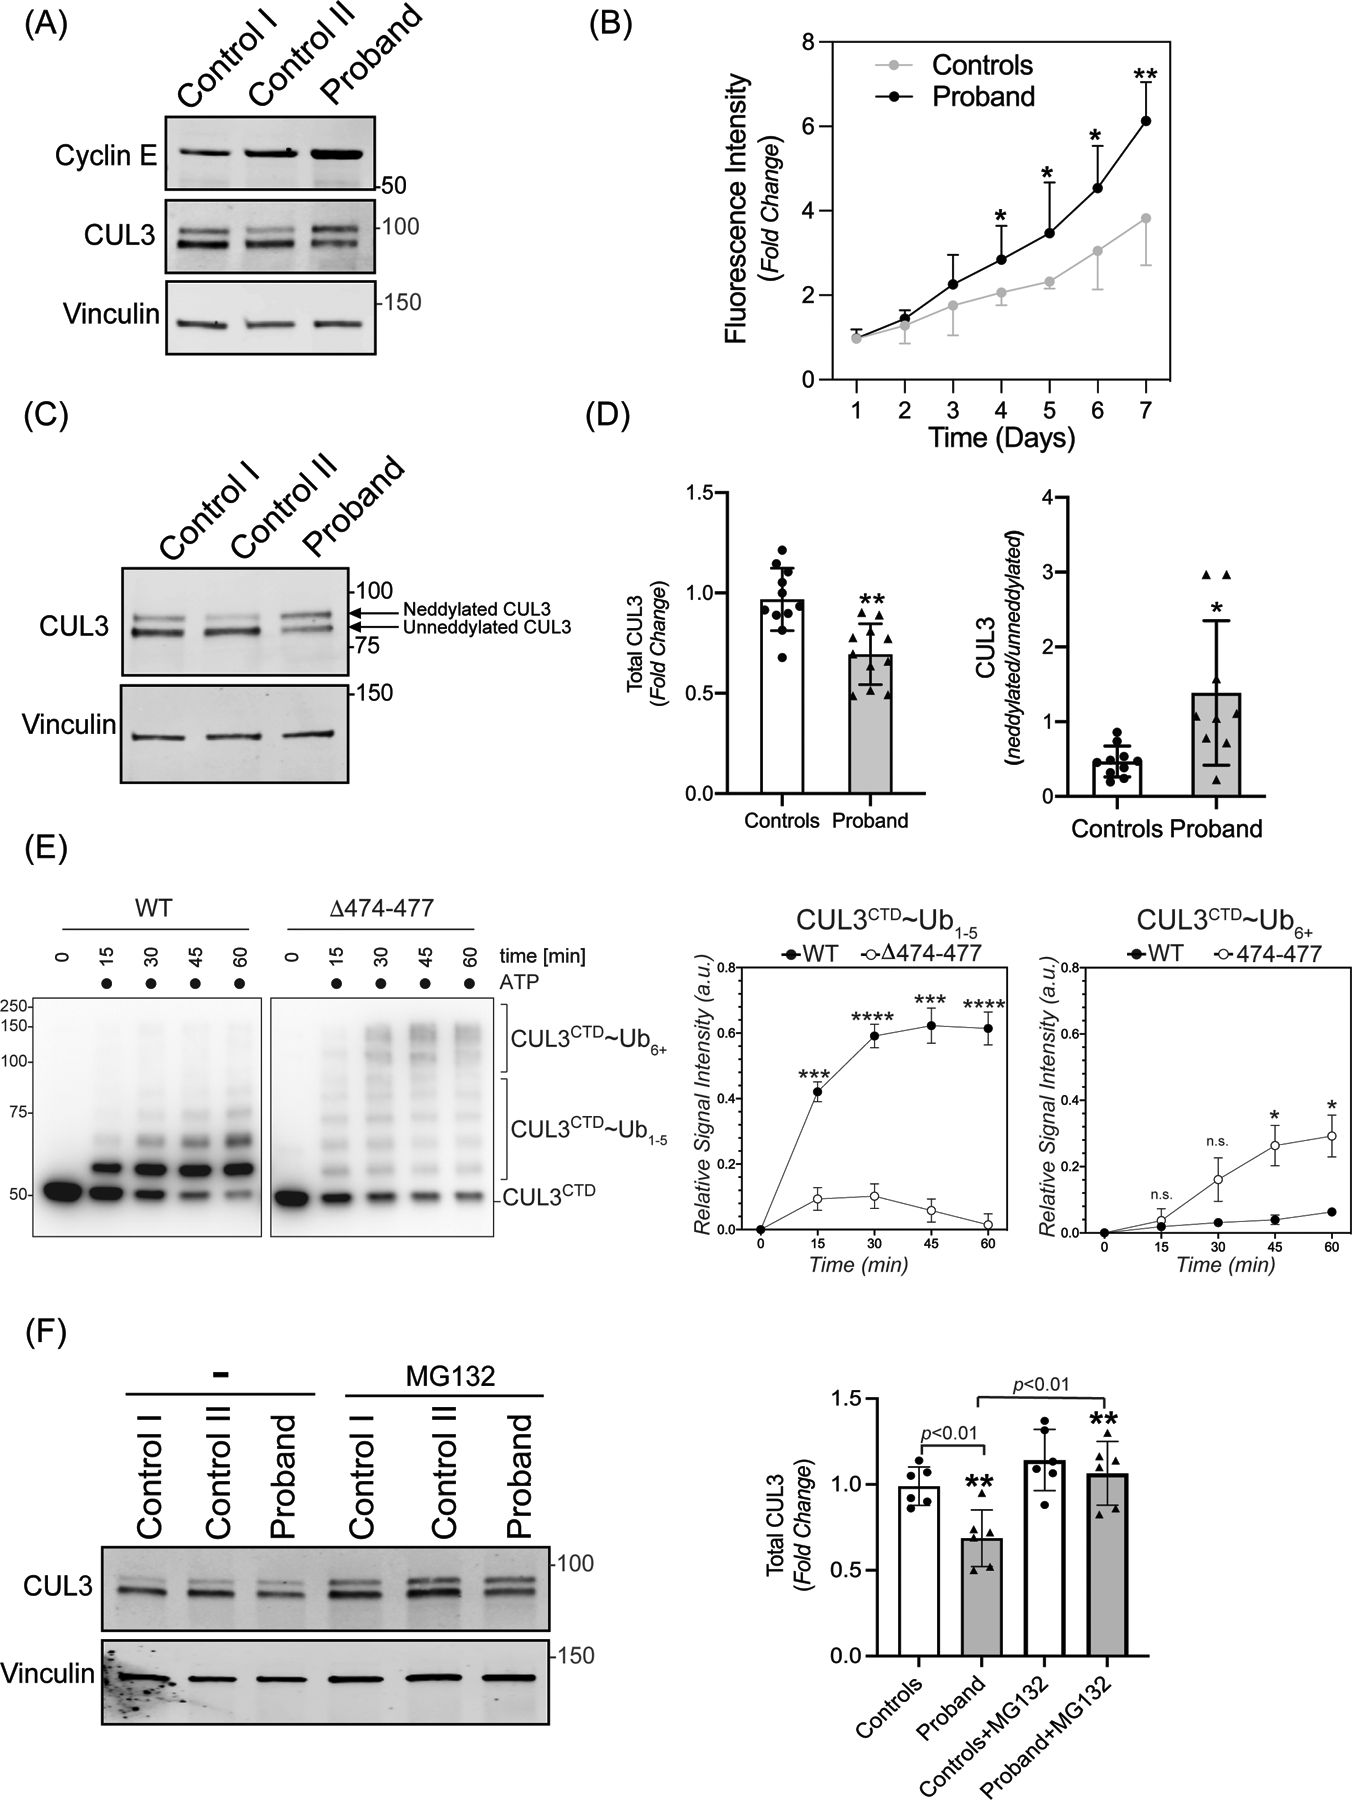
Figure 2: The 474–477 deletion affects CUL3 protein levels and auto-ubiquitination.

(A) Increased abundance of canonical CRL3 substrate. Fibroblasts from controls and the patient were lysed in RIPA buffer. Levels of Cyclin E were analyzed through immunoblotting of fibroblast lysates from controls and patient fibroblasts using anti-Cyclin E antibodies. Immunoblotting of lysates with anti-Vinculin confirmed equal loading of the samples. (B) Increased rate of proliferation of patient’s fibroblasts. Quadruplicate samples of fibroblasts from patient and two controls were plated into a 96 well plate. Fluorescence measurements of each well were quantified using AlamarBlue dye every 24 hours for 7 days. Patient fibroblasts exhibited significantly increased rates of cellular proliferation compared to controls on days 4–7. Data are represented as fold change of proliferation from day 1. Control represents mean value of two independent controls (error bars indicate ± SD, *= P<0.05, **= P <0.01, student t-test). (C) Total CUL3 abundance and neddylation in fibroblasts. Controls and the patient fibroblasts were lysed in RIPA buffer. Western blot analysis using a polyclonal antibody against CUL3, and subsequent quantitation of bands revealed a reduced abundance of total CUL3 along with a significantly greater ratio of neddylated to unneddylated CUL3 relative to controls. Anti-Vinculin antibody was used to confirm equal loading of the samples. (D) Quantification shows fold change in protein abundance (left) and neddylated/unneddylated CUL3 (right). The control value represents the mean of data from four independent controls (samples are technical replicates, error bars indicate ± SD, n = 9–11 independently performed experiments. **= P<0.01, *= P<0.05, student t -test (E) Left Panel (immunoblots) CUL3/Rbx1 and CUL3Δ474–477/Rbx1 complexes were recombinantly purified using a strategy in which the CUL3 is split into a N-terminal domain (NTD, aa1–309) and C-terminal domain (CTD, aa310–768) and co-expressed with RBX1. These complexes were incubated with recombinant ubiquitin, UBA1, and UBCH5C in the absence or presence of ATP for the indicated time periods. Reactions were stopped by addition of urea sample buffer, separated by SDS-PAGE, and the CTD of CUL3 was detected by immunoblotting with anti-CUL3 antibodies. Right Panel (graphs) Quantification of ubiquitination efficiency for the experiment shown in the left panel. CUL3 modification with 1–5 ubiquitins (CUL3~Ub1–5) or more than 5 ubiquitins (CUL3~Ub6+) was quantified relative to unmodified protein at t=0 min followed by a baseline correction to 0. (n=4 independently performed in vitro experiments, * = P<0.05, *** = P<0.001, **** = P<0.0001, multiple t-test). (F) Left Panel (immunoblots) Control and patient fibroblasts were treated with 10 μM MG132 for 18 hrs. prior to lysis in RIPA buffer and subsequent immunoblotting with anti-CUL3 antibody. Vinculin was used as a loading control. (Right Panel) Quantification shows fold change in total CUL3 abundance. The control value represents the mean of data from two independent controls (error bars indicate ± SD, n = 6 independently performed experiments; samples are technical replicates. **= P<0.01, student t-test).
