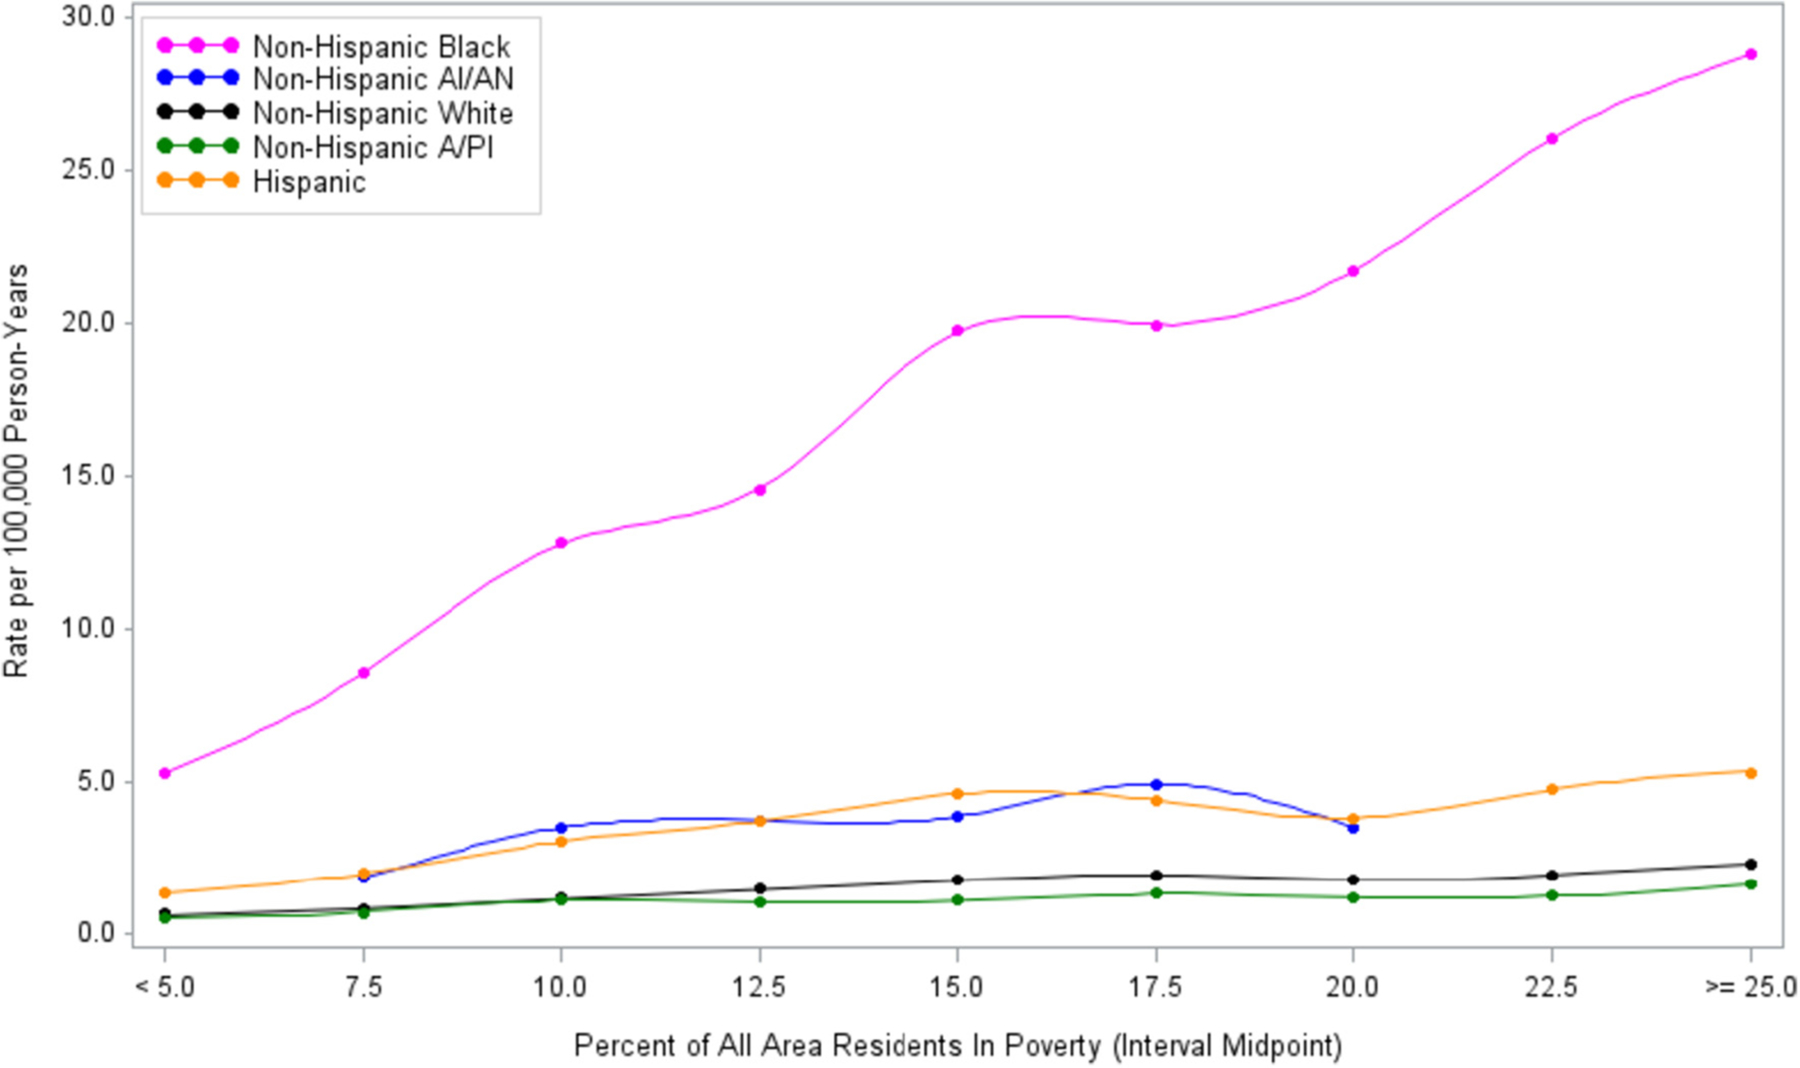
Fig. 3.

Age-adjusted firearm homicide rates – associations with poverty by ethnicity/race – large metro counties (part of a metropolitan statistical area with ≥1 million population), 2004–2018. Data sources: National Vital Statistics System Mortality Data (ICD-10 Underlying Cause Codes X93–X95, U01.4); National Center for Health Statistics / U.S. Census Bureau Bridged-Race Population Estimates; U.S. Census Bureau Small Area Income and Poverty Estimates Program. Note: Rates based on homicide counts <20 not displayed due to lack of statistical stability. Abbreviations: AI/AN - American Indian/Alaska Native; A/PI - Asian/Pacific Islander.
