Figure 1.
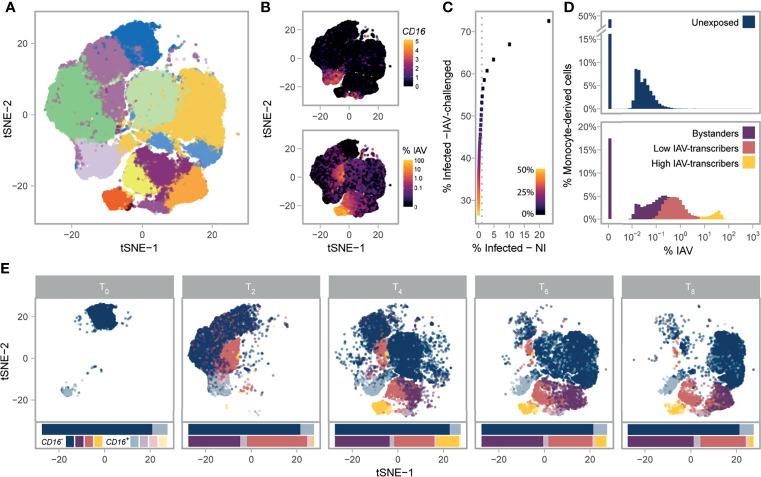
Single-cell RNA-sequencing of 88,559 monocytes and their derived cells. (A) Post-QC tSNE colored by unsupervised graph-based clusters. (B) Post-QC tSNE colored by FCGR3A (CD16) log2 normalized counts (top), or percentage of viral mRNAs (bottom). (C) Determination of the maximum contamination fraction by ambient RNA. The number of non-infected cells deemed to significantly express IAV transcripts (presumed false positives) versus the number of IAV-challenged cells deemed to significantly express IAV transcripts across a range of maximum contamination fractions from 1-50% (color bar). Dotted grey line is drawn at 1% on the x-axis. A maximum contamination fraction of 10% results in 1% of non-infected cells being classified as infected (false positive proxy), and half of IAV-challenged cells showing evidence of viral transcription. (D) Distribution of counts of viral origin across all donors, from T2 to T8. Cells are shown separately for non-infected (top) and IAV-challenged (bottom) conditions. Fill color reflects the cell state assignments. Note that the threshold used to define infected cells is dependent on the number of viral mRNAs in the ambient pool, and varies across libraries. (E) Post-QC tSNE stratified by time point. For each time point, cells are colored according to their CD16+/- status (see key) and their assigned cell state (same as depicted in D). For each condition and time point, stacked bar charts below the tSNE represent the relative proportions of the various cell states and subsets. IAV, Influenza A virus; NI, non-infected; tSNE, t-distributed Stochastic Neighbor Embedding.

