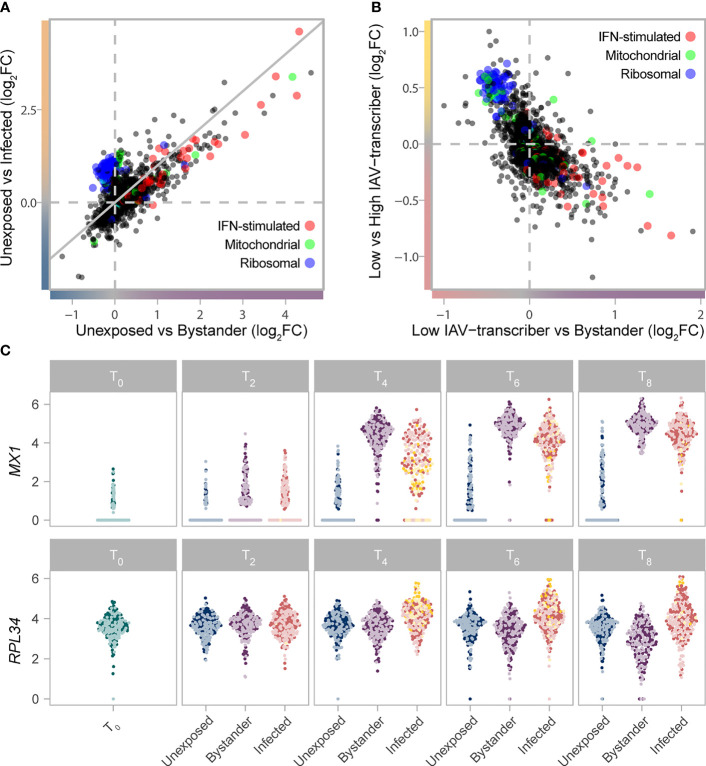
Figure 2.
Gradient of mRNA expression from ribosomal and IFN-stimulated genes separates bystander and infected cells. (A) Transcriptional responses of cells upon IAV challenge (T2-T8) highlight the interplay between IFN-stimulated (GO:0034340), ribosomal (GO:0005840), and mitochondrial (GO:0005743) genes. The log2FC change in gene expression between unexposed and bystander cells is plotted on the x-axis, while the log2FC change in gene expression between unexposed and infected cells is plotted on the y-axis. Values are plotted based on a meta-analysis across time points and subsets, of a subsampled dataset with balanced representation of all donors. (B) The interplay between IFN-stimulated (GO:0034340), ribosomal (GO:0005840), and mitochondrial (GO:0005743) genes among cells exposed to IAV. The log2FC change in gene expression between low IAV-transcribing infected and bystander cells is plotted on the x-axis, while the log2FC change in gene expression between low IAV-transcribing infected and high IAV-transcribing infected cells is plotted on the y-axis. Values are plotted based on a meta-analysis across monocyte subsets at T4. (C) mRNA expression levels of representative IFN-stimulated (MX1) and ribosomal (RPL34) genes across the subsampled dataset. Colors reflect the cell state and subset assignment depicted in Figures 1D, E . IFN, Interferon; FC, fold change.

