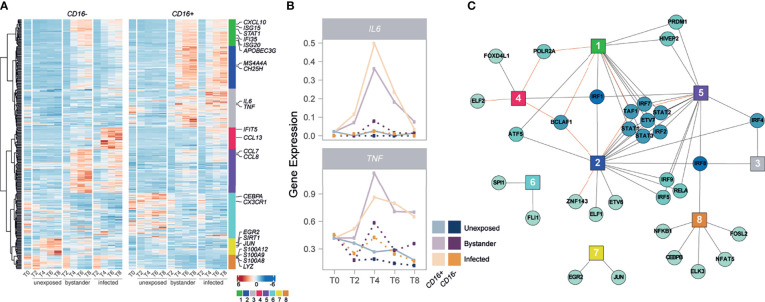
Figure 3.
IRFs and STATs have a central role in the subset-specific responses to IAV infection. (A) Heatmap of scaled gene expression from 335 genes displaying a subset-specific response to infection challenge. Genes are grouped into 8 modules based on hierarchical clustering of their expression patterns. Representative genes from each module are labelled. (B) Mean expression over time of IL6 and TNF, across the different monocyte subsets and cell states. (C) Network of transcription factors (round nodes) associated with each gene expression module (square nodes). Transcription factor nodes are colored according to the number of modules they are associated with. Black lines represent enrichments of the module in TF targets, while red lines represent depletions.

