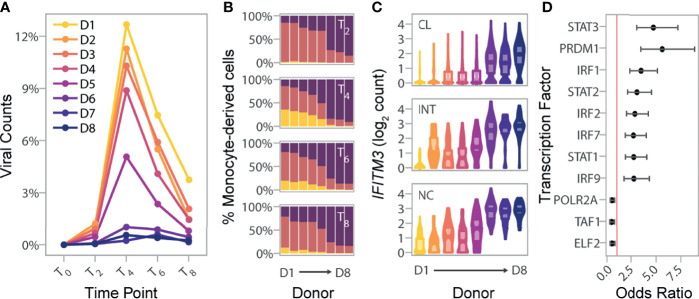
Figure 4.
Basal IRF/STAT-induced transcriptional network underlies inter-individual differences in monocyte susceptibility and IAV levels. (A) Pseudo-bulk estimates of the percentage of counts of viral origin in IAV-challenged condition (T2-T8). Donors are colored based on the rank of these pseudo-bulk estimates at the peak of viral transcription, T4, from that with highest observed viral mRNA level (D1) to that of the lowest (D8). (B) Proportions of cell states from the IAV-challenged condition at T2, T4, T6, and T8, in the eight donors. X-axis is ordered by decreasing viral mRNA levels found at T4 (D1-D8). (C) Log normalized expression values of IFITM3 across all cells, stratified by canonical monocyte subsets, and separated by donor. Colors reflect the different donors depicted in (A) For each donor and monocyte subset, the violin plots show the full distribution of IFITM3 expression across individual cells and boxplots highlight the median and interquartile range. (D) Enrichment of SCENIC-predicted targets among the 118 genes whose basal expression at T0 correlates with the percentage of infected cells at later time points (odds ratio and 95% confidence interval). Red line designates an odds ratio equal to 1. Only TFs significantly enriched among the 118 candidate genes are shown (FDR < 0.05). CL, classical; INT, intermediate; NC, nonclassical.

