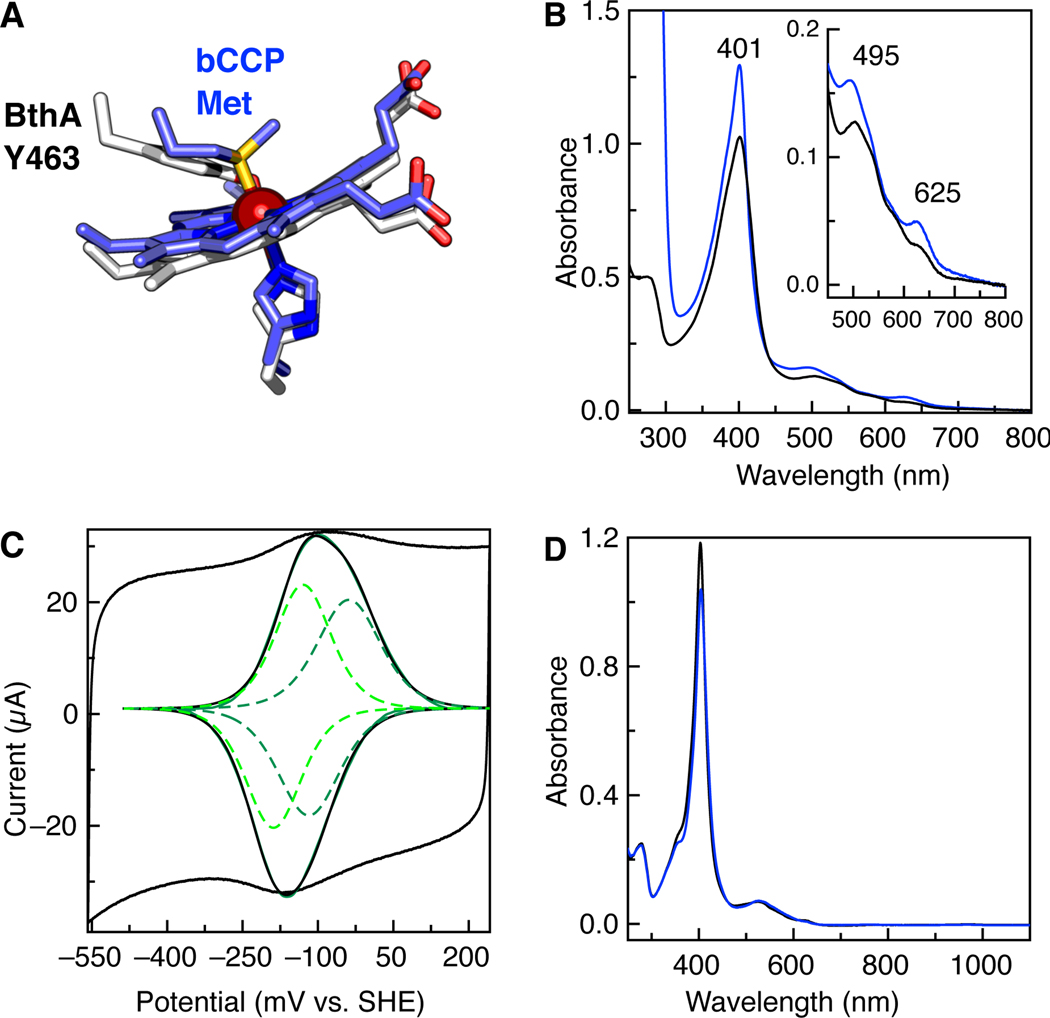
Figure 1.
Biophysical characterization of the BthA Y463M variant. (A) Schematic of the 6c heme coordination of BthA and MauG (white) and bCCPs (slate), comparing BthA (PDB ID 6NX0.pdb) and CcpA from Shewanella oneidensis (3O5C.pdb). (B) Absorption spectra of aerobically purified (solid) and ascorbate treated (blue) Y463M BthA. (C) Voltammogram of Y463M at pH 7.3, 21˚C, 50 mV/s. Raw voltammogram is shown (black) with the baseline subtracted (black, inset) with fit for the overall signal (green) and individual species fit (green dotted lines, inset). (D) Spectra of 5 μM as-isolated Y463M (solid black line) and then treated with 10x H2O2 (blue)., 50 mM HEPES, pH 7.8.

