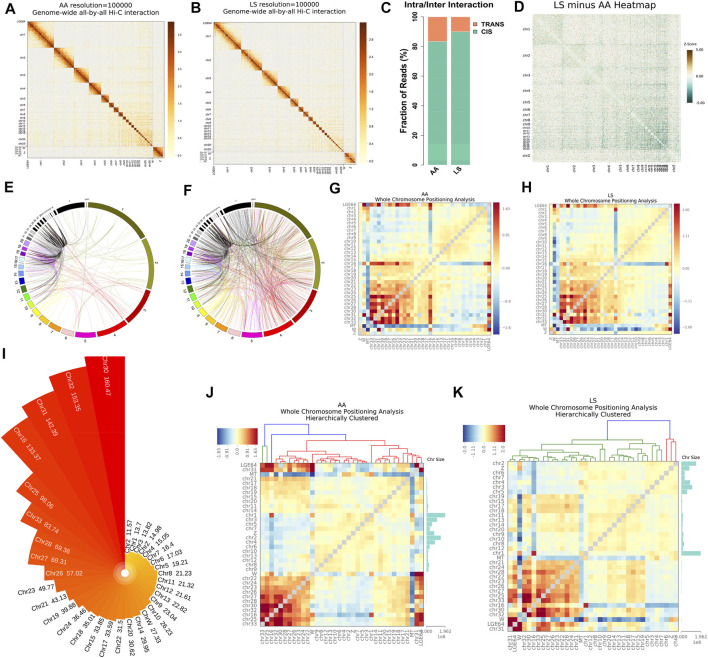
FIGURE 2.
Chromatin cis/trans interaction analysis of AA and LS chicken breast muscle using Hi-C. (A,B) Genome-wide all-by-all Hi-C interaction heatmap of breast muscles in AA broiler and LS chicken, respectively. (C) Genome-wide cis/trans interaction percentage of AA and LS chicken breast muscles. (D) Genome-wide heatmap of significant differential interactions between AA and LS chicken breast muscles. Chromosomes are stacked from top left to bottom right from chr1 through chr20 and chrZ. The red color represents LS-enriched interactions and the green color represents AA-enriched interactions, the white regions are the insignificantly changed interacting regions between the two breeds. (E,F) Circle plot from 1,000 bin pairs with the strongest trans-interaction in AA and LS chicken breast muscles, respectively. (G,H) Standardized trans-interaction using observed/expected number of contacts between all pairs of whole chromosomes in AA and LS chicken breast muscles, respectively. (I) Gene density of each chromosome in chicken. (J,K) Hierarchical clustering analysis of whole chromosome positioning between chromosomes of AA and LS chicken breast muscles, respectively.

