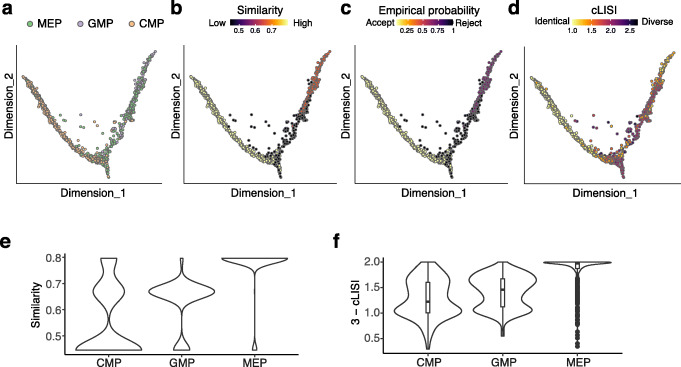
Fig. 9.
CIDER identifies a high level of heterogeneity within the CMP population in the mouse hematopoietic progenitor data (Dataset 8). A–D Diffusion maps of the CCA-corrected data, where cells are colored by cell populations (A), the similarity score computed by CIDER (B), the empirical probability of rejection (C), and the local purity represented by 3-cLISI (D). E The distribution of agreement (y-axis), denoted by the similarity calculated by CIDER, between two experiments for three cell populations (x-axis), CMP, GMP, and MEP. F The distribution of agreement, denoted by 3-cLISI, between two experiments

