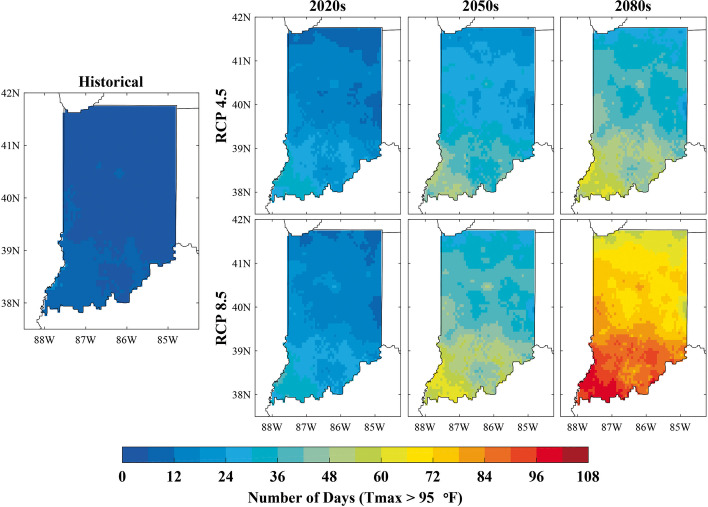
Fig. 1.
Extremely hot days in Indiana. Annual number of days with extremely hot temperatures (daily high temperature over 95 °F). Seven panels: historical (1915–2013) and 2020s, 2050s, and 2080s with RCP4.5 (medium emissions) and RCP8.5 (high emissions). Graphic originally appears in Hamlet et al. (2019)

