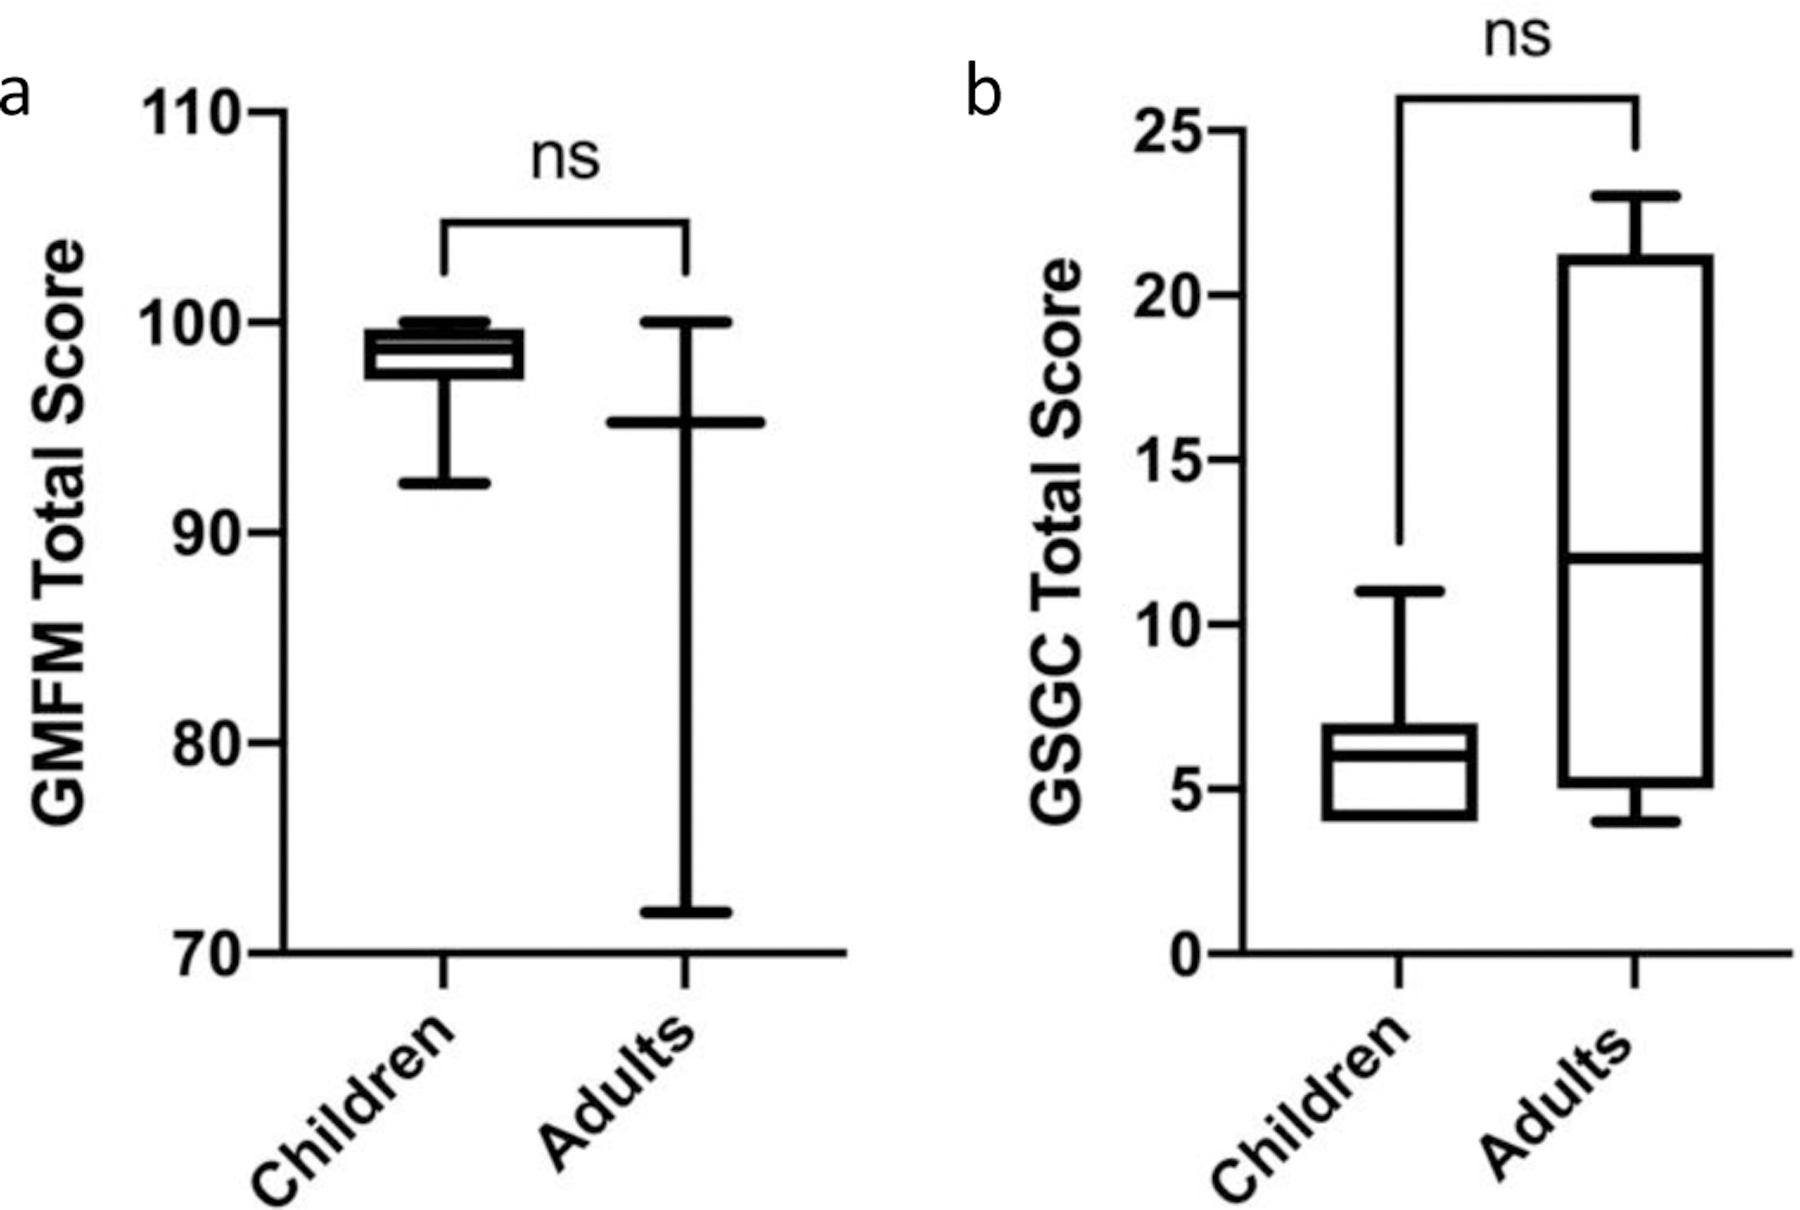
Figure 2: GMFM and GSGC Scores of Children and Adults with GSD IIIa.

a. GMFM performance ranges from a 0–100 percent, with 100 percent representing normal function. There was no significant difference between performance on the GMFM between children and adults with GSD IIIa, as measured using a Mann Whitney test. b. GSGC performance ranges from 4–27, with 4 representing normal function and 27 representing inability to perform any of the tasks. There was no significant difference between performance on the GSGC between children and adults with GSD IIIa; however, the majority of children demonstrated at least some reduction in performance. Performance of children and adults was analyzed using a Mann Whitney test. For both graphs, ns = not significant.
