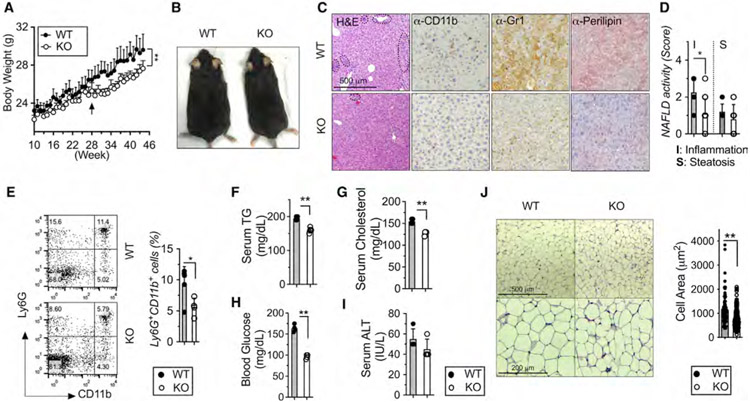
Figure 1. Myeloid-restricted loss of METTL3 prevents age-related incidence of obesity and NAFLD.
Eight- to 10-week-old Mettl3 KO and WT littermate mice were fed with regular chow up for 45 weeks (n = 6–9).
(A) Body weight.
(B) Body morphology.
(C) Liver sections stained by H&E, anti-CD11b, anti-Gr1, and anti-Perilipin antibody (Ab) (4 images per mouse). Circline indicates typic infiltrating area.
(D) NAFLD histological activity scores for steatosis and inflammation were determined quantitatively from (C).
(E–H) Fluorescence-activated cell sorting (FACS) analysis and quantification of liver Ly6G+/CD11b+ cells. Levels of (F) serum TGs, (G) serum cholesterol, (H) fasting blood glucose, and (I) serum ALT were measured.
(J) scWAT sections by H&E and quantification of adipose areas. Data represent mean ± SD (n = 10–15). *p < 0.05; **p < 0.01 by two-tailed Student’s t test or two-way ANOVA. Scale bars are shown as indicated.

