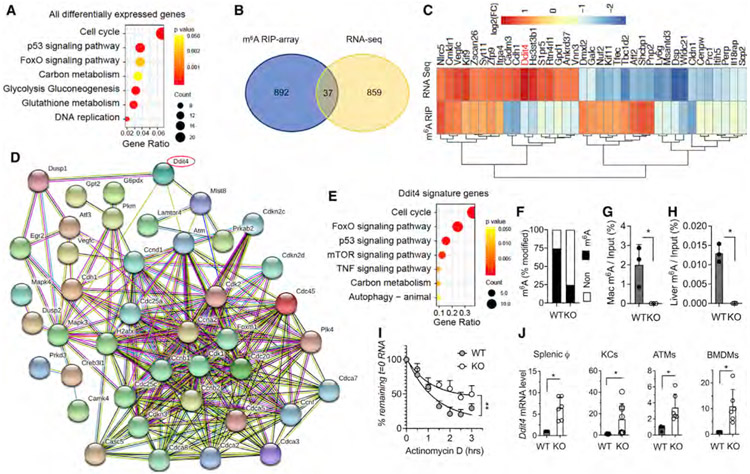
Figure 3. DDIT4 represents a major m6A-decorated gene in macrophages.
Splenic macrophages (CD11b+F4/80+ cells) were sorted from 10-week-old KO and WT littermates. Total RNA was purified and applied to RNA-seq and m6A-microarray analysis.
(A) KEGG analysis of all the differentially expressed genes of KO versus WT with significance (p < 0.05).
(B) Venn diagram analysis of populations of mRNA with significant changes in expression levels or m6A decoration in KO versus WT.
(C) Heatmap of 37 genes with significant changes in expression levels and m6A decoration in KO versus WT.
(D) STRING network analysis of DDIT4-associated gene signatures with pre-enrichment from KEGG and further validated pathways from (A).
(E) Gene Ontology (GO) analysis of DDIT4-associated gene signatures from (D).
(F) Percentage of m6A methylation of mRNA in KO versus WT.
(G and H) MeRIP-m6A using mRNA from thapsigargin (thap)-treated macrophages from KO and WT control (G) and liver tissue from aged KO and WT control (H). DDIT4 transcripts quantified by qRT-PCR are shown as percentage of input RNA (n = 3).
(I) Fitted exponential decay curve of Ddit4 mRNA expression after actinomycin D (2.5 μM) treatment. The residual mRNAs were normalized to t = 0.
(J) mRNA level of DDIT4 gene expression in KO from splenic macrophages, KCs, ATMs, and BMDMs was confirmed by qRT-PCR. The gene expression level was normalized to β-actin. Data represent mean ± SD (n = 10–15). Two-tailed Student’s t test or two-way ANOVA: *p < 0.05.

