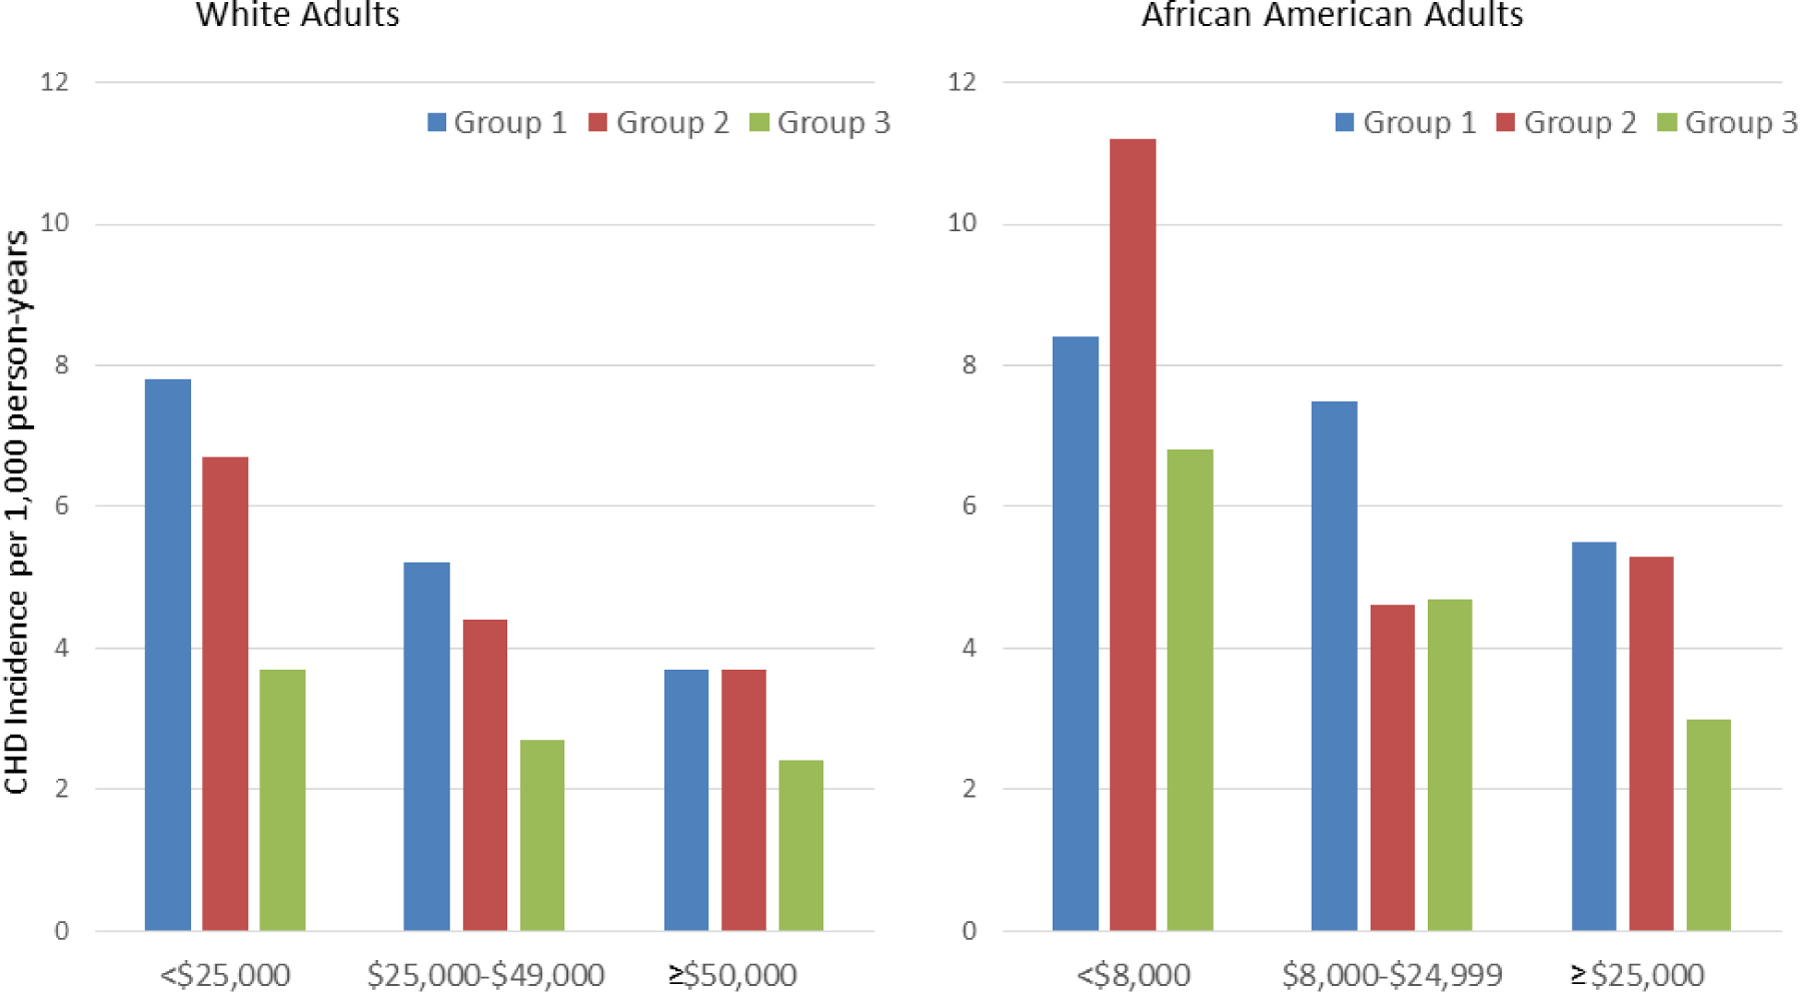
Figure 3. CHD Incidence Rates for Race and Neighborhood Groups.

CHD incidence rates were adjusted for age, study site, and sex and are shown according to neighborhood group and personal income level. In whites and African Americans, neighborhood groups were defined according to summary socioeconomic scores. Group 1 (scores in the lowest third) corresponds to the most disadvantaged neighborhoods, and group 3 (scores in the highest third) corresponds to the most advantaged neighborhoods. Neighborhood scores were created using six neighborhood characteristics of wealth and income: 1) median household income, 2) median value of housing units, 3) percent of households receiving interest, dividend, or rental income, 4) percent of households with adults 25 years and older who completed high school, 5) percent of adults 25 years and older who completed college, and 6) percent of employed persons 16 years and older who were occupied in executive, managerial, or professional occupations. Republished with permission from Diez Roux AV, Merkin SS, Arnett D, e tal. Neighborhood of residence and incidence of coronary heart disease. N Engl J Med. 2001 Jul 12;345(2):99–106.
