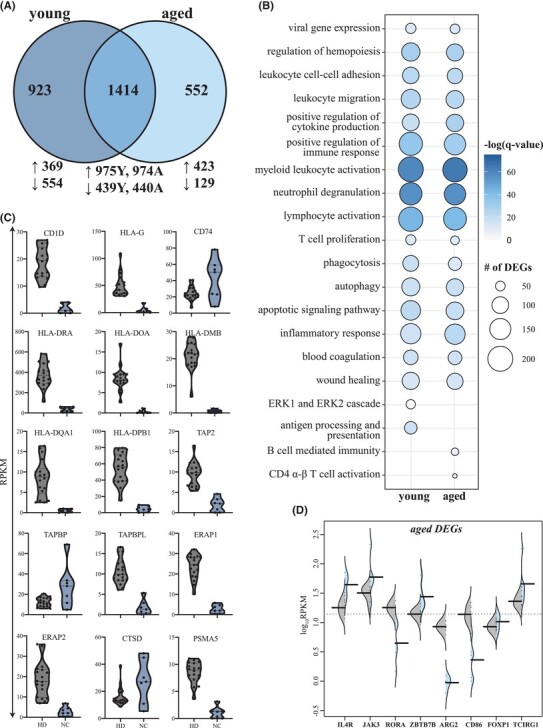
FIGURE 1.

Transcriptional profiling of severe COVID-19 reflects innate and adaptive immune dysregulation. (A) Venn diagram of differentially expressed genes (DEGs) computed for young or aged patients not treated with corticosteroids (ND) relative to age- and sex-matched HD. (B) Bubbleplot representing the functional enrichment of DEGs detected in young and aged patients identified in panel (A). The size of each circle represents the number of DEGs belonging to the indicated gene ontology (GO) term while color represents the FDR-corrected P-value (q-value). (C) Violin plots depicting normalized transcript counts of DEGs belonging to GO term “antigen processing and presentation” (young patients); grey color represents healthy donors (HD) while the blue color represents the non-CORT treated group (NC) (D) Violin plots depicting normalized transcript counts of DEGs belonging to GO terms “CD4 alpha-beta T cell activation” and “B cell-mediated immunity” (aged patients); grey color represents healthy donors (HD) while the blue color represents the non-CORT treated group (NC)
