
FIGURE 2.
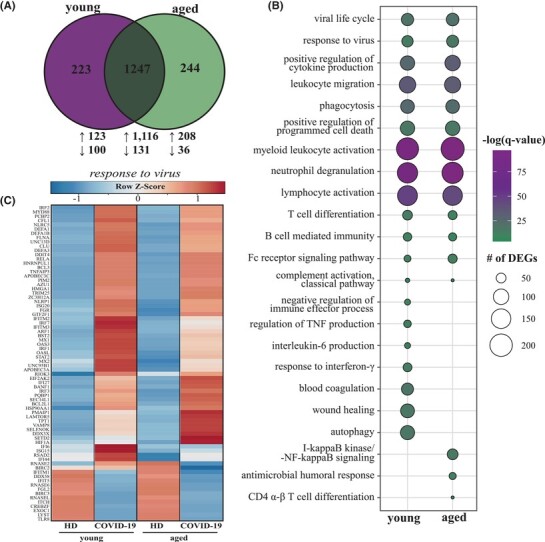
Young and aged corticosteroid-treated COVID-19 patients exhibit overlapping and distinct transcriptomes. (A) Venn diagram of differentially expressed genes (DEGs) computed for CORT-treated patients relative to age- and sex-matched HD in panel (A). (B) Bubbleplot representing the functional enrichment of DEGs detected in young and aged patients identified in panel (B). The size of each circle represents the number of DEGs belonging to the indicated gene ontology (GO) term while color represents the FDR-corrected P-value (q-value). (C) Heatmap representing DEGs enriching to all DEGs enriching to “response to virus” in young and aged patients. Each column represents the average rpkm for the given group. Range of colors is based on row-scaled and centered rpkm values of the represented DEGs. Red represents high expression while blue represents low expression