
FIGURE 3.
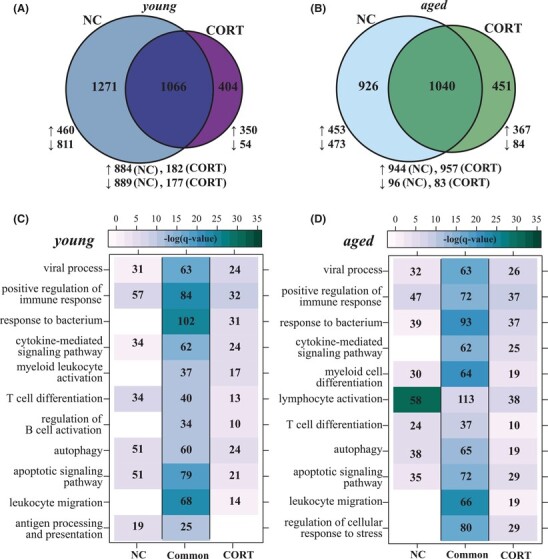
Corticosteroids treatment modulates transcriptional responses in acute COVID-19. Venn diagrams representing DEGs between corticosteroid (CORT)-treated and untreated (NC) for (A) young and (B) aged patients. Functional enrichment of CORT-unique, NC-unique and shared DEGs in panels (A) and (B) for (C) young and (D) aged cohorts. Color intensity represents the statistical significance (shown as the negative log of the FDR-adjust P-value, -log(q-value)) with a range of colors based on the GO terms with the lowest and highest –log(q-value) values for the entire set of genes per cluster. Numbers of genes enriching to each GO term per cluster are represented in each box; blank boxes indicate no statistical significance