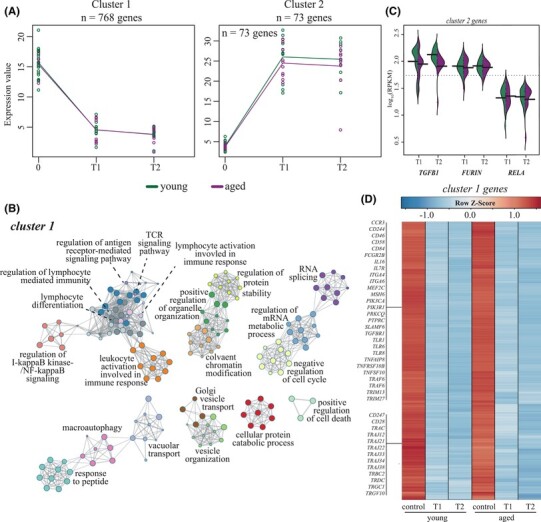
FIGURE 4.

Regression analysis identifies longitudinal downregulation of key antiviral and T cell genes in both young and aged CORT-treated patients. (A) Gene expression (in rpkm) of 2 gene clusters identified by 2-ways forward regression analysis. (B) Gene ontology (GO) network depicting functional enrichment of the 500 genes contributing the most to variation seen in PCA using Metascape. Clustered nodes of identical color correspond to one GO term. Node size represents the number of DEGs associated with the GO term. Gray lines represent shared interactions between GO terms, with density and number indicating the strengths of connections between closely related GO terms. (C) Heatmap depicting gene expression of cluster 1 genes. Exemplar genes are labeled. Each column represents the average rpkm for the given group and timepoint. Range of colors is based on row-scaled and centered rpkm values of the all the DEGs in the heatmap. Red represents increased while blue represents decreased expression relative to the median. (D) Beanplot representing expression of exemplar genes identified in cluster 2 (panel A) in young and aged patients at T1 and T2
