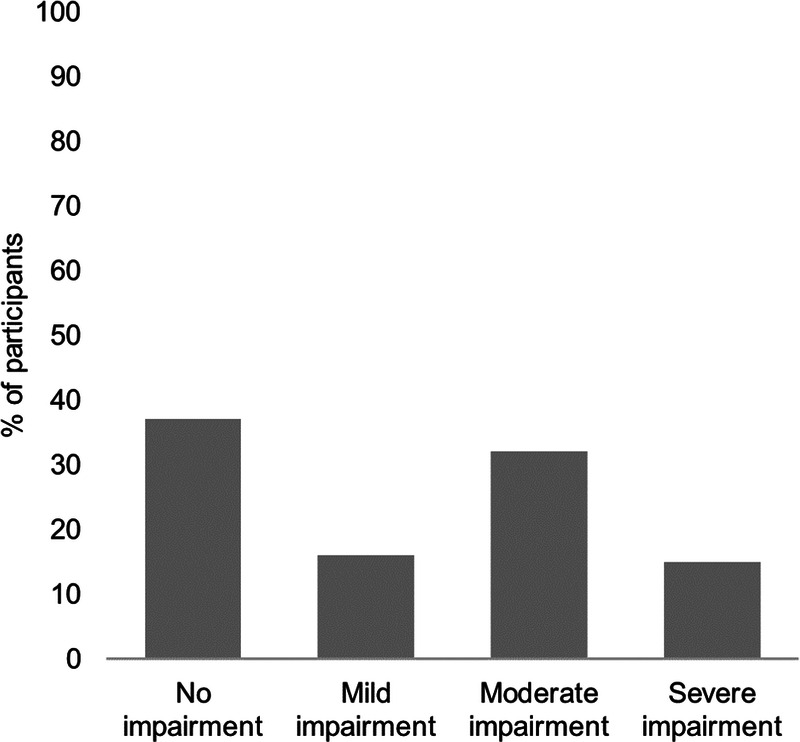
FIGURE 3.

Neuro-QoL level of impairment according to t scores in patients who completed the measure (n = 155). Neuro-QoL scores have a mean of 50 and SD of 10 in a referent population. T scores 40–45 indicate mild dysfunction, t scores 30–40 indicate moderate dysfunction, and t scores less than 30 indicate severe dysfunction.
