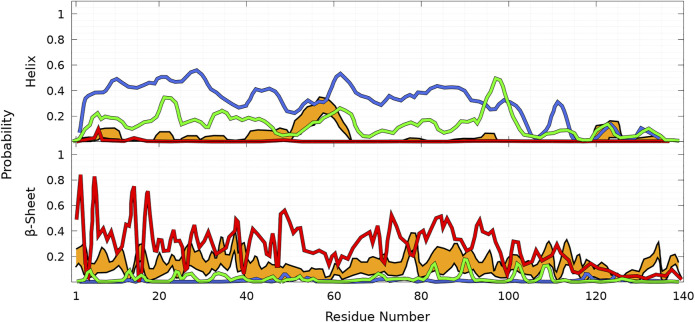
FIGURE 10.
Probability of each residue of WT to pertain to an α-helix (top panel) and a β-sheet (bottom panel) as a function of its position in the sequence from MD simulations according to four different works: Ullman et al., 2011 (orange), Yu et al., 2015 (blue), Ramis et al., 2019 (red), and Coskuner and Wise-Scira, 2013 (green). The thickness of the orange lines corresponds to the 95% confidence interval. Excerpted of the published figures of the works cited are reproduced with permissions. Further permissions related to the material excerpted should be directed to the corresponding publishers.

