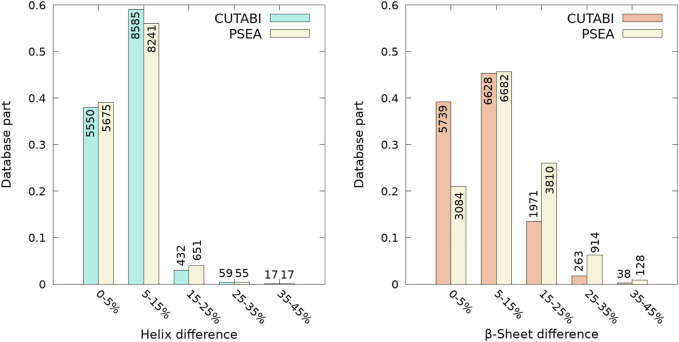
FIGURE 2.
Comparison between the identification of residues pertaining to the helix and to β-sheet between the all-atom DSSP algorithm and coarse-grained CUTABI and P-SEA algorithms. Each bar of the histograms represents the number of structures of the ASTRAL database as a function of a range of percentages of the difference between CUTABI (green and orange) and DSSP and between P-SEA (yellow) and DSSP. For each protein, the percentage is calculated as the number of residues having a different secondary structure in the coarse-grained algorithms and DSSP, divided by the protein sequence length.

