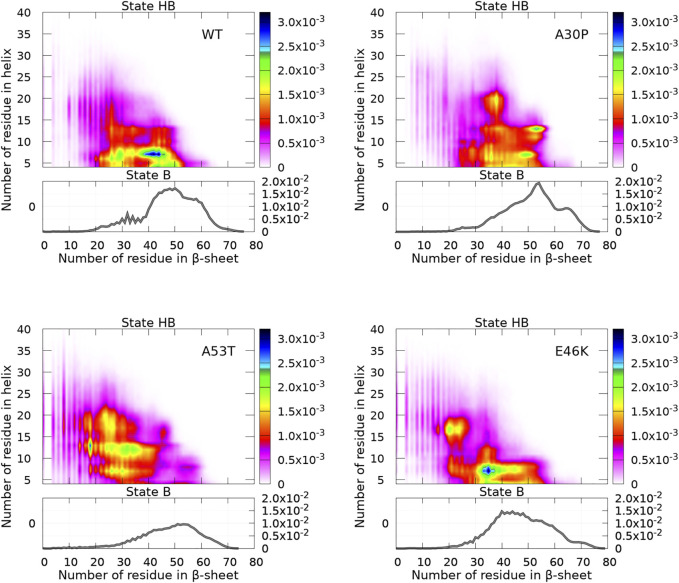
FIGURE 4.
Probability density of the number of residues in the α-helix and β-sheet for WT and mutants of α-syn. The probability density of state B (no helix) is represented by a function (gray) (right vertical axis), and the probability density of state HB is represented by a two-dimensional map (right color bar).

