
FIGURE 5.
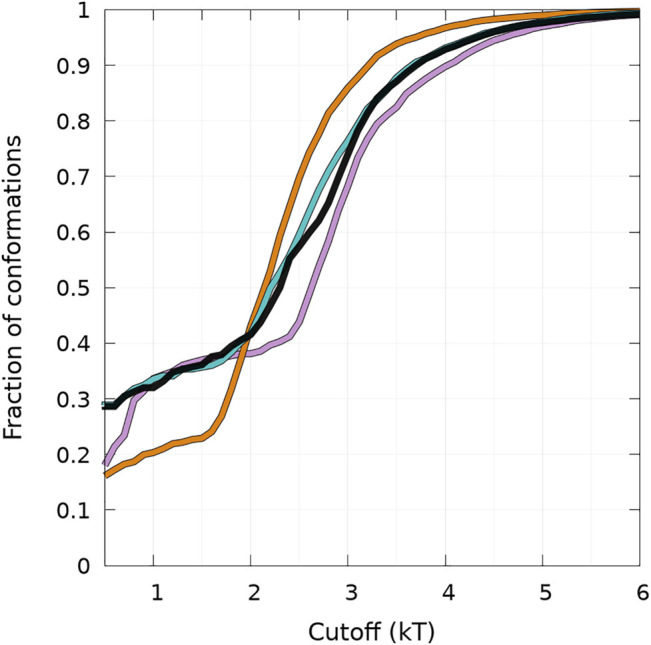
Cumulative fraction of the total number of conformations simulated as a function of a free-energy cutoff (in kT units) from the global minimum of the B state (see text) represented in Figure 4. Curves are for WT (black), A30P (purple), E46K (turquoise), and A53T (orange).